Figure 3. Permeation and ion selectivity of Panx1 channels.
(a) HOLE (Smart et al., 1996) diagram demonstrating constrictions along the permeation pathway. NTL; N-terminal loop. (b) Surface representation of the internal space along the molecular 7-fold axis running through the center of frPanx1. The surface was generate using HOLE. (c and d) Top view facing the extracellular side (c) or side view (d) of frPanx1, with ECL1 shown in light blue and ECL2 in dark blue. Trp74 and Arg75 are shown as sticks. (e) Reversal potentials of various hPanx1 ion selectivity mutants. Each point represents the Erev measured in NaCl (black), NaGluc (red), or NMDGCl (blue), and bars represent the mean values. I-V curves were obtained by a ramp protocol from −80 mV to +80 mV. (f) Close-up view of the Trp74-Arg75 interaction at the interface of protomer A (blue) and B (red).

Figure 3—figure supplement 1. Representative traces of the ramp recordings.

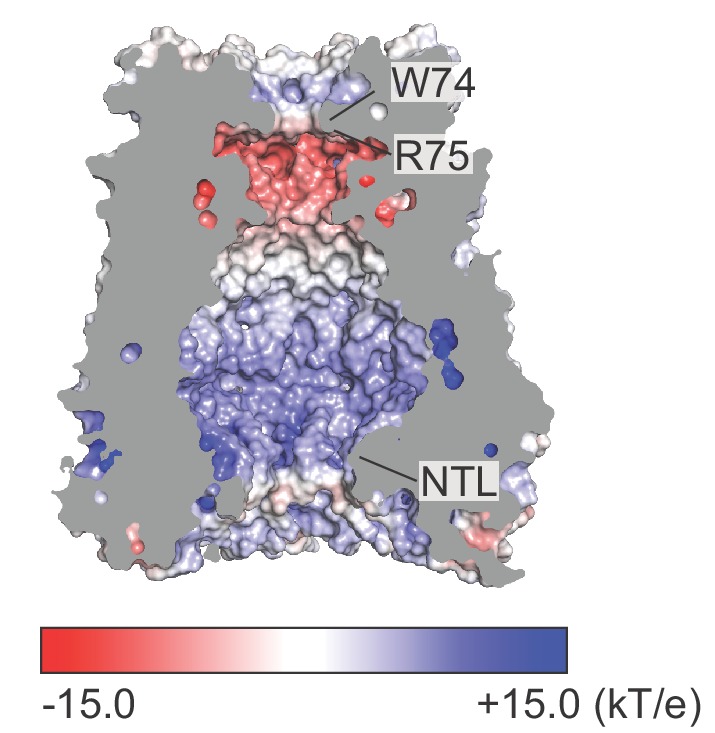
Figure 3—figure supplement 2. Electrostatic surface potential of the ion permeation pathway.