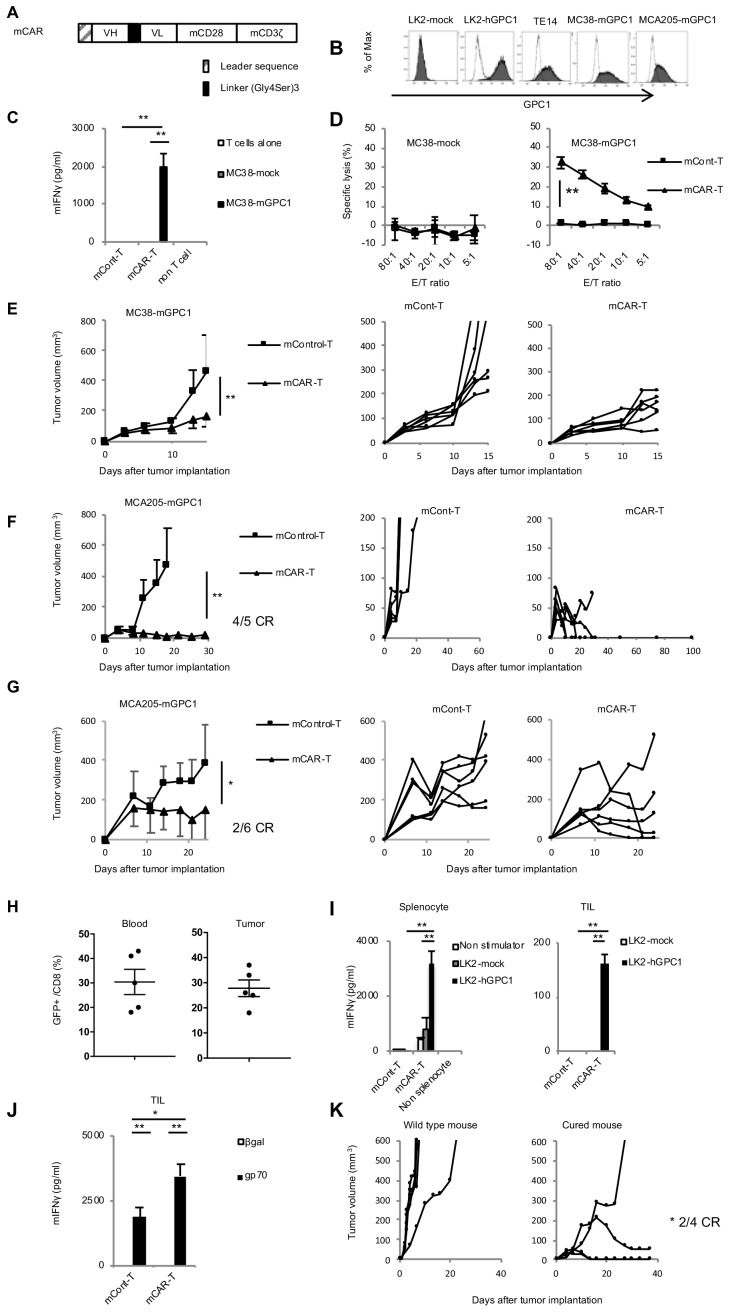
Figure 4. GPC1-specific murine mCAR-T cells specifically recognized mGPC1-positive tumor cells and eradicated solid tumors in vivo.
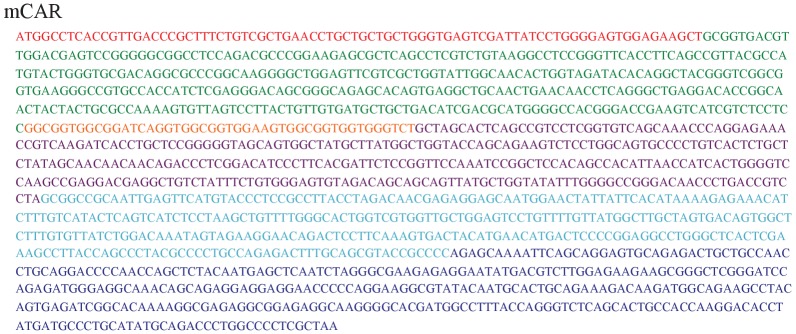
(A) Diagram of GPC1-specific murine CAR; scFv fragment (HL) derived from anti-GPC1 mAb (clone: 1–12) was fused to mouse CD28 and CD3ζ signal domains. (B) The mGPC1-overexpressing murine cells (MC38-mGPC1 and MCA205-mGPC1), endogenous hGPC1-expressing human cells (TE14), and hGPC1-overexpressing human cells (LK2-hGPC1), hGPC1-negative cells (LK2-mock) were stained with anti-GPC1 mAb (shaded histogram) or isotype control (open histogram). (C) Antigen-specific IFNγ secretion of mCAR-T cells or mCont-T cells co-cultured with MC38-mGPC1 or MC38-mock was evaluated. (D) Antigen-specific cytotoxicity of mCAR-T cells or mCont-T cells against MC38-mGPC1 and MC38-mock was evaluated by using standard Cr51 releasing assay. (E and F) Mice bearing MC38-mGPC1 tumor (E) or MCA205-mGPC1 tumor (F) received 2 × 10⁶ cells of mCAR-T cells or mCont-T cells on day 3. Mean tumor volumes (mm3 ± SD) of each group (left panels) and tumor-growth curves of the individual mice in each group (right panels) are shown. (G) Mice bearing MCA205-mGPC1 large tumor (tumor volume is >100 mm3) received 3.5 × 10⁷ cells of mCAR-T cells or mCont-T cells on day 7. Mean tumor volumes (mm3 ± SD) of each group (left panels) and tumor-growth curves of the individual mice in each group (right panels) are shown. (H) Percentages of GFP-positive CD8+ mCAR-T cells in total CD8+ T cells from peripheral blood and tumor tissues on day 15 are shown. Dots indicate mice in each group. (I) Splenocytes (left panel) or CD8+ TIL (right panel) were collected from the mice treated with mCAR-T cells or mCont-T cells on day 15, and co-cultured with LK2-hGPC1 or LK2-mock. After 24 hr, IFNγ in the supernatants was measured by ELISA. (J) CD8+ TIL collected from the mice treated with mCAR-T cells or mCont-T cells were re-stimulated with irradiated normal splenocytes pulsed with gp70 peptides. After 48 hr, the re-stimulated TIL were collected and co-cultured with murine tumor cells pulsed with gp70 or control peptide (βgal) for 24 hr and IFNγ in the supernatants was measured by ELISA. Results are representative of two or three experiments. Error bars indicate SD. (K) 120 days after the mCAR-T cell administration, mGPC1-negative parental MCA205 was inoculated in the naive mice with no history of bearing tumors or the mice which had rejected MCA205-mGPC1 by mCAR-T cells injection. Tumor-growth curves of the individual mice in each group are shown.


