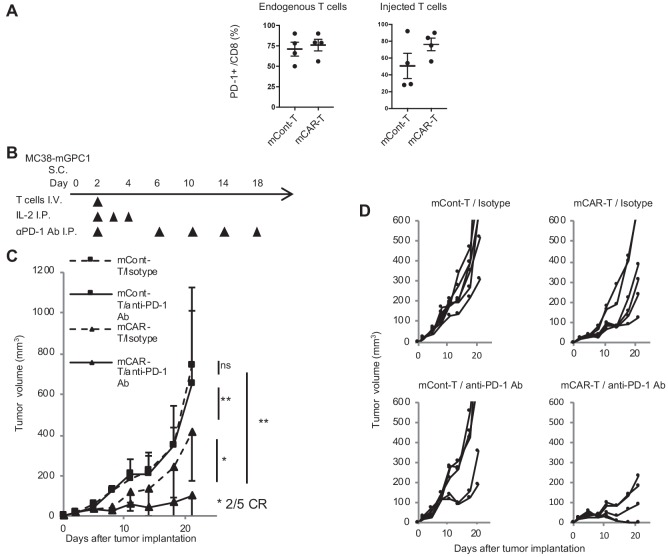
Figure 6. GPC1-specific mCAR-T cells synergized with anti-PD-1 Ab.
(A) Percentages of PD-1-expressing cells among endogenous CD8+ T cells (left panel) and injected CD8+ T cells (right panel) harvested from the tumor tissues of MC38-mGPC1 mouse model 12 days after mCAR-T cell or mCont-T cell administration. Dots indicate individual mice of each group. (B) The protocol of combination therapy is shown. Mice bearing MC38-mGPC1 were treated with 2 × 10⁶ cells of mCAR-T cells or mCont-T cells on day 2 and anti-PD-1 Ab (200 mg/mouse) or isotype Ab were intraperitonealy injected on days 2, 6, 10, 14, and 18. (C) Mean tumor volume (mm3 ± SD) of each group is shown. (D) Tumor-growth curves of the individual mice in each group are shown. Results are representative of two or three experiments. Error bars indicate SD.

