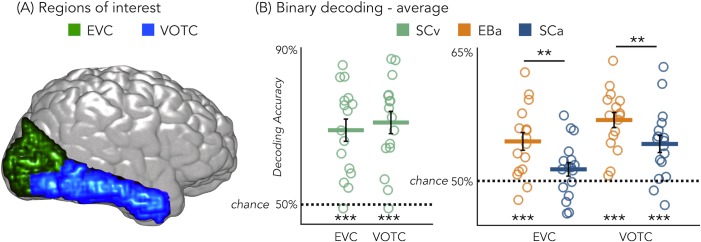
Figure 3. Regions of interest and classification results.
(A) Representation of the 2 ROIs in one representative subject’s brain; (B) Binary decoding averaged results in early visual cortex (EVC) and ventral occipito-temporal cortex (VOTC) for visual stimuli in sighted (green), auditory stimuli in blind (orange) and auditory stimuli in sighted (blue). ***p<0.001, **p<0.05.

