
Figure 7. VOTC Inter-subject correlation within and between groups.
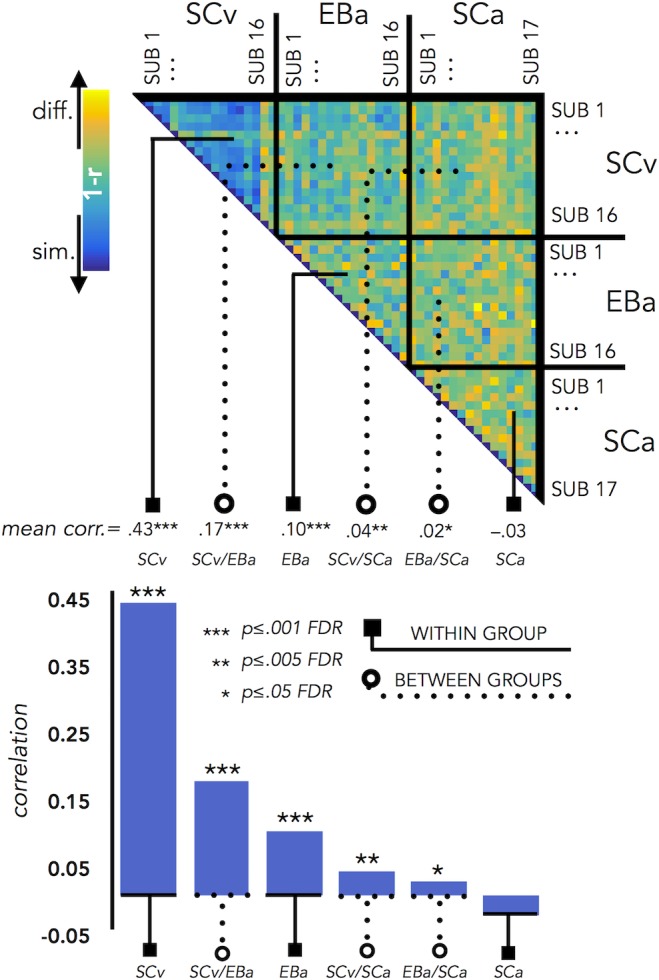
Upper panel represents the correlation matrix between the VOTC brain DSM of each subject with all the other subjects (from the same group and from different groups). The mean correlation of each within- and between-groups combination is reported in the bottom panel (bar graphs). The straight line ending with a square represents the average of the correlation between subjects from the same group (i.e. within groups conditions: SCv, EBa, SCa), the dotted line ending with the circle represents the average of the correlation between subjects from different groups (i.e. between groups conditions: SCv-EBa/SCv-SCa/EBa SCa). The mean correlations are ranked from the higher to the lower inter-subject correlation values.