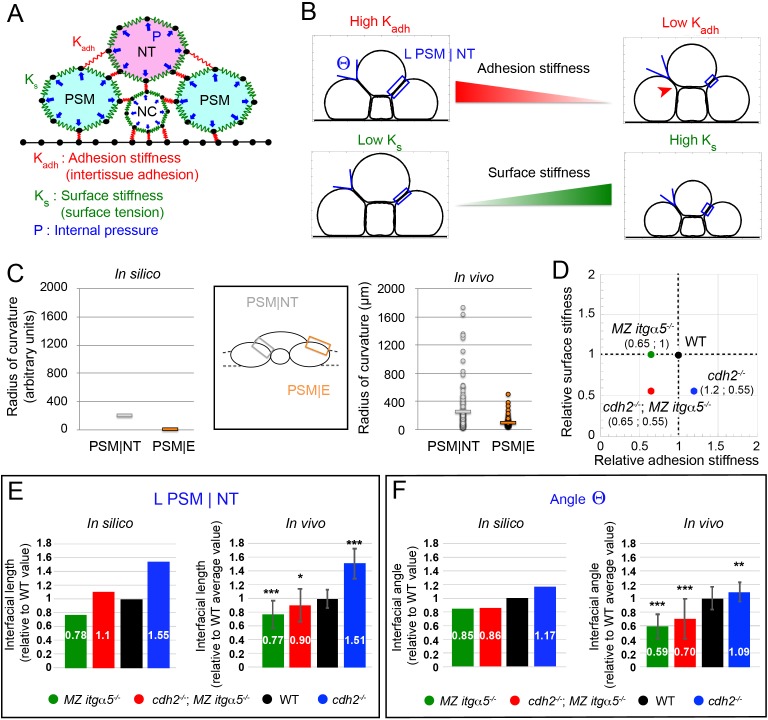
Figure 2. A computational model predicts tissue shapes across genotypes.
(A) A coarse-grained 2D model of a transverse section with three model parameters. Tissues are modeled as soft units with a fixed internal pressure (P, blue arrows), a surface stiffness (green springs along the tissue surfaces with individual spring constant Ks), and an adhesion stiffness (red springs connecting adjacent tissues with individual spring constant Kadh). Black dots represent material points subject to the forces. Black lines at the bottom model a rigid yolk surface. See Materials and methods for further details. (B) Variation of adhesion stiffness and surface stiffness in the model have opposing effects on the angle formed at the interface between PSM and neural tube (angle Θ) and on the length of the PSM|NT interface (L PSM|NT, blue box). Decreasing adhesion stiffness decreases interfacial angle and length, while decreasing surface stiffness increases angle and length. Reduction of adhesion stiffness also produces inter-tissue gaps showing local detachments (red arrowhead, top right panel). See Materials and methods for parameter values. (C) Radius of curvature for the PSM|NT interface (grey) and the PSM|E interface (orange) in silico (left panel) and in vivo (right panel). n = 150 on 75 sections from five embryos. (D) Different genotypes are arranged in a 2D parameter space according to their estimated levels of surface stiffness and adhesion stiffness relative to wild type. See Materials and methods for the details of the parameter values. (E–F) Comparison of Interfacial length (L PSM|NT) (E) and angle Θ (F) across genotypes relative to the average wild-type values, measured in silico and in vivo. Data represent mean with SD. Measurements in vivo were performed within the 140 μm posterior of last somite. n interfacial lengths = 150 on 75 sections on five embryos for WT and MZ itgα5-/-; 123 on 64 sections on five embryos for cdh2-/-; 129 on 73 sections on five embryos for cdh2-/-; MZ itgα5-/-. n angles = 145 on 75 sections on five embryos for WT; n = 115 on 63 sections on five embryos for cdh2-/-; 137 on 72 sections on five embryos for MZ itgα5-/-; 133 on 65 sections on five embryos for cdh2-/-; MZ itgα5-/-. T-tests were performed for the following comparisons: cdh2-/- vs WT, p=2.97E-25 (L PSM|NT) p=0.0007 (angle Θ); MZ itgα5-/- vs WT, p=1.16E-13 (L PSM|NT) p=5.37E-30(angle Θ); MZ itgα5-/-;cdh2-/- vs WT, p=0006 (L PSM|NT) p=4.34E-11 (angle Θ).


