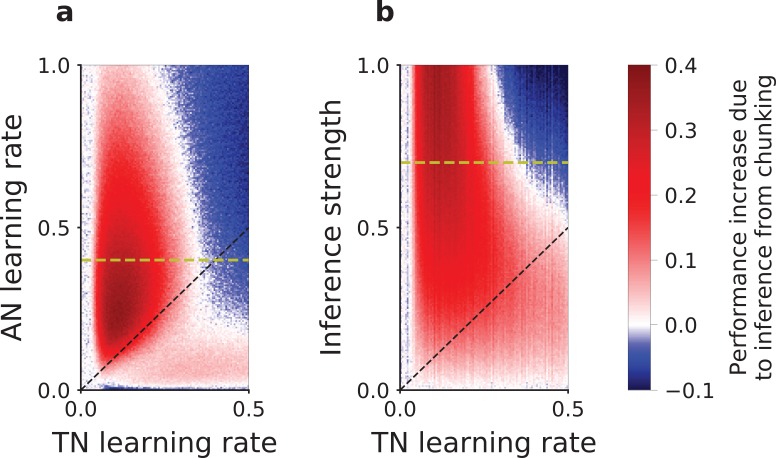
Figure 4. Slow versus fast learning: conditions for correct encoding of task-sets in the network model.
(a) Difference in the performance of the network model with or without task-set inference, plotted as a function of the associative network learning rate and the task-set network learning rate , (with and inference strength ). (b) Same difference in performance but plotted as a function of the inference strength and the task-set network learning rate , (with and associative network learning rate ). We computed the performance averaged over the five first correct responses for a stimulus, in the last third of the session, on an average of 200 runs of the recurrent session and with 10% noisy trials. The dashed black lines mark the diagonal. The dashed yellow lines correspond to and respectively, and relate (a) to (b).

