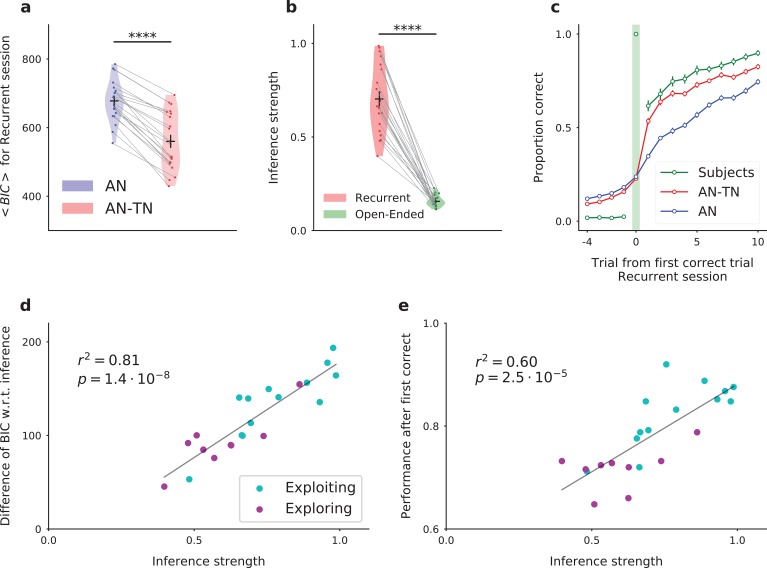
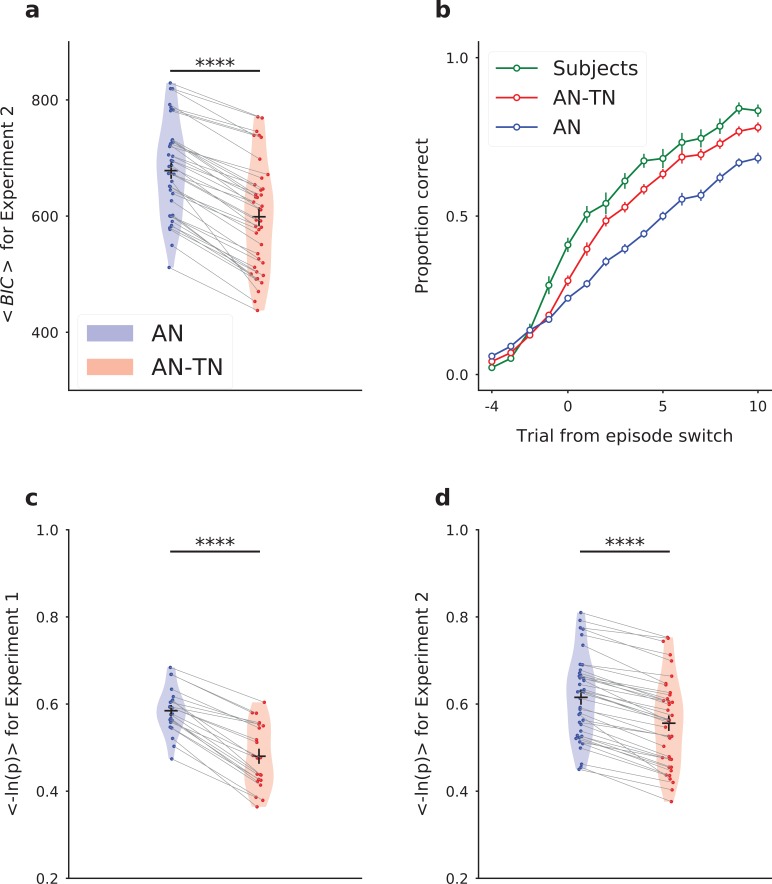
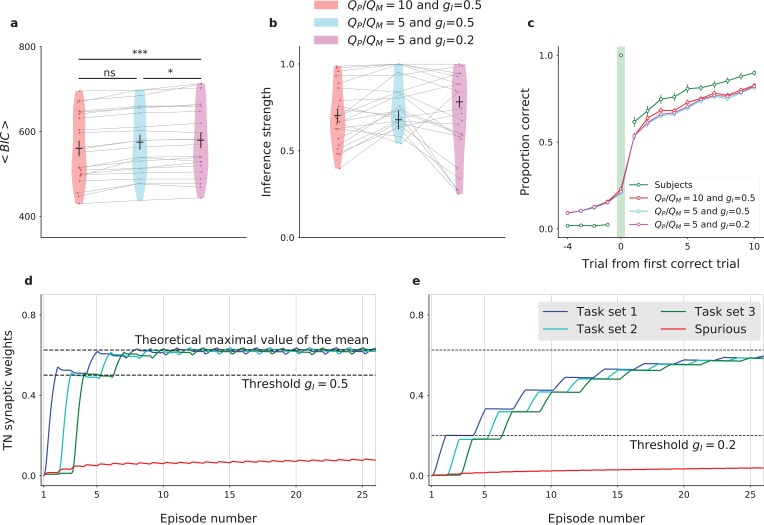
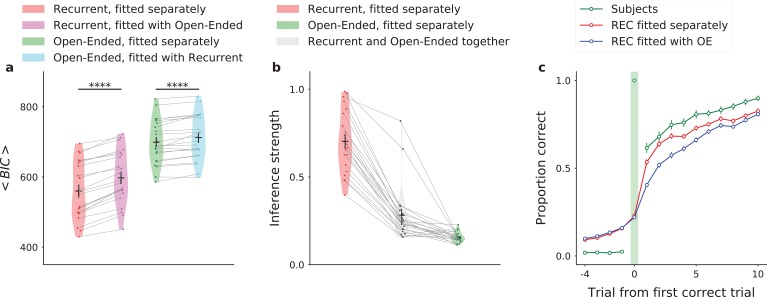
Figure 5. Fitting the model to experimental data: the model with inference (AN-TN) captures the statistical structure of the data, and accounts for the variability between subjects.
(a) Model comparison for the recurrent session. Bayesian Information Criterion (see Materials and methods) for the models with and without task-set inference. The model provides a significantly better fit with inference than without. (b) Estimate of the inference strength from the task-set network to the associative network connectivity in the model with task-set inference, for both sessions. (c) Proportion correct around the first correct trial, averaged over episodes and over subjects, for the recurrent session. (d) Subject by subject difference between BIC values obtained for models with and without task-set inference, as a function of the inference strength parameter, for the recurrent session. Subjects are classified as ‘exploiting’ or ‘exploring’ from a post-test debriefing. The grey line displays a least-squares regression. (e) Subject by subject performance following the first correct trial in an episode, as a function of the inference strength parameter, for the recurrent session. The performance was computed by considering the 10 trials following the first correct trial of each episode. The grey line displays a least-squares regression. .


