. 2020 Mar 9;9:e50469. doi: 10.7554/eLife.50469

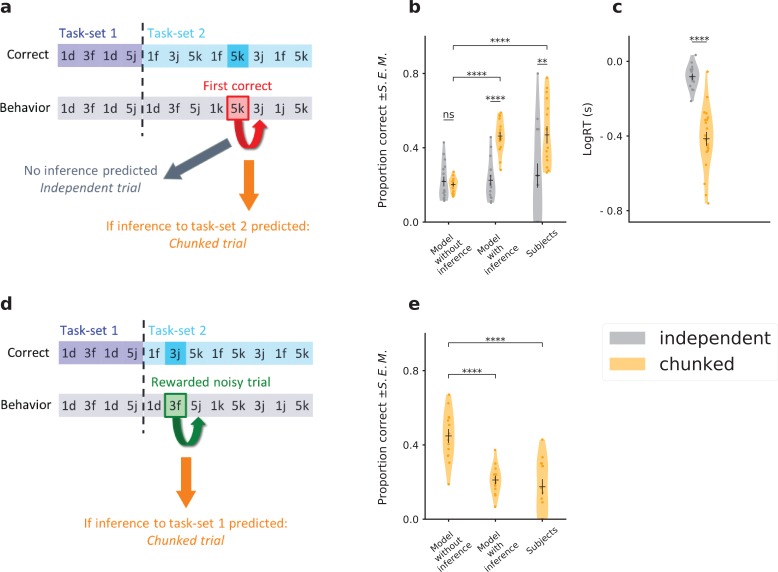
Figure 6. Testing the predictions of the temporal chunking mechanism on specific trials.

(a) Schematic of the prediction for correct task-set retrieval. For each episode switch, and subject by subject, we compute the probability of making a correct choice after the first correct trial, for a different stimulus. Trials are classified from a model-based criterium as ‘chunked’ or ‘independent’, respectively depending on the presence or absence of an inference from the task-set network to the associative network. (b) Because of task-set inference, the model predicts a significant increase of performance on chunked trials compared to independent trials. This is not predicted by the associative network alone (‘Model without inference’). Subjects’ performance on these trials matches the model with inference. The error bars are larger for the independent trials because this category contains half the amount of data, as shown in Figure 6—figure supplement 1. (c) Log of subjects’ reaction times in seconds, for trials classified as chunked or independent. (d) Schematic of the prediction for task-set retrieval following misleading rewarded trials. After each episode switch, the subject makes incorrect choices. On 10% of these trials the feedback is misleadingly rewarded (e.g. 3f, which corresponds to a correct association for the previous task-set, but not for the current task-set). Because of the inference from the task-set network, the previous task-set can be incorrectly inferred by the model from the misleading reward. (e) Probability of a correct association after a misleadingly rewarded noisy trial classified as a chunked trial by the model. The model with inference predicts an incorrect association at the next trial, producing a decrease in performance. This decrease is not predicted by the associative network alone (‘Model without inference’). Subject’s performance on these trials matches the model with inference. Violin plots display the shape of each distribution (Scott’s rule). Dots display the average for each subject. The black lines outline the mean ± s.e.m. .

Figure 6.

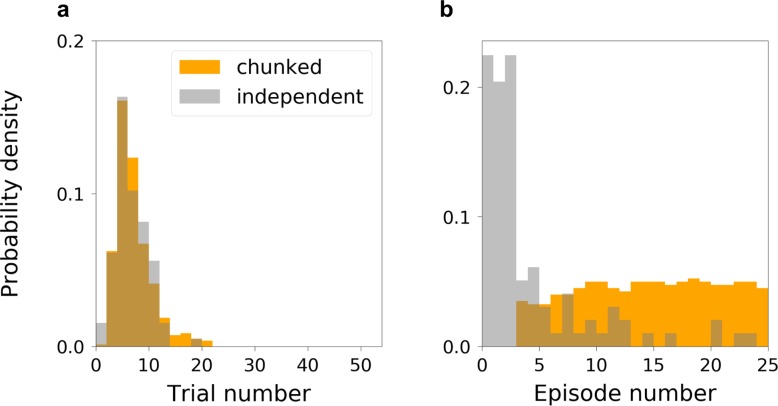
Figure 6—figure supplement 1. Task-set retrieval prediction.

Figure 6—figure supplement 1.

(a) Distributions of trial numbering for the two categories of trials, chunked and independent. The distributions are not significantly different (a Kolmogorov-Smirnov test gives ks=0.085, p=0.62). (b) Distributions of episode numbering for the two categories of trials, chunked and independent. We consider only one trial per episode. Generally, independent trials are from early episodes, and chunked trials are from late episodes, consistently with the expected learning progress.
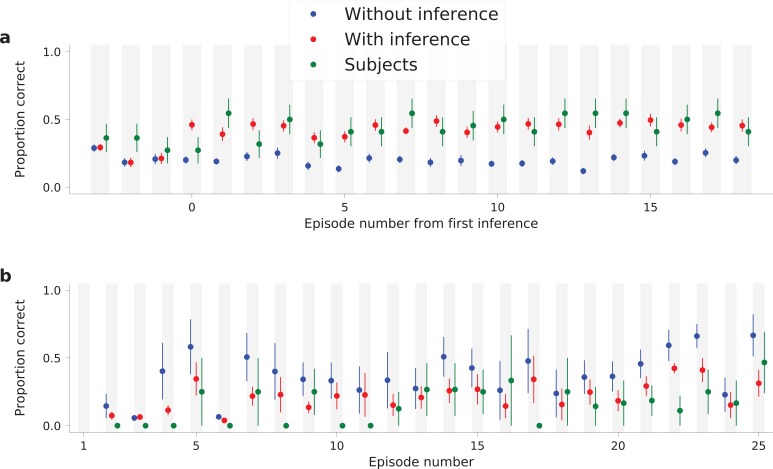
Figure 6—figure supplement 2. Testing the predictions of the temporal chunking mechanism as learning evolves.

Figure 6—figure supplement 2.

The mean over subjects is represented as a colored dot, for the AN (‘Without inference’, in blue), the ANTN (‘With inference’, in red), and subjects’ data (in green). (a) Data of Figure 6b splitted according to episode number from the first episode where the model predicted an inference signal at the first correct trial, on a subject-by-subject basis. This panel shows that even at the end of the session, the retrieval of a task-set is not complete and instantaneous, so that a mixture of gating and gradual update is present. (b) Data of Figure 6e splitted according to episode number, so as learning evolves. This panel shows that the subjects’ probability of making a correct association after a misleadingly rewarded noisy trial is not null, even for the last episodes, after extensive learning of the three task-sets, and argues again for a combination of gradual and sudden updates as implemented in the present model. All are expressed as mean ± s.e.m.
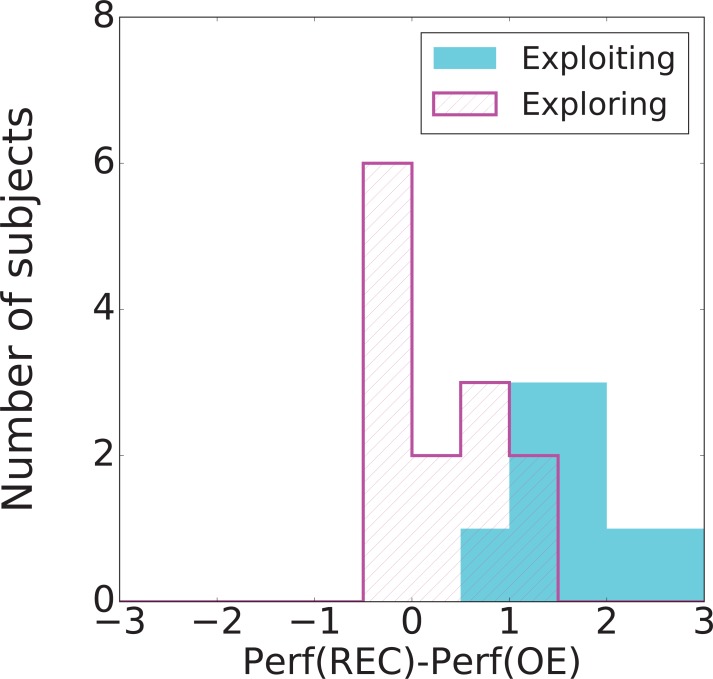
Figure 6—figure supplement 3. Histograms over subjects of the difference of performance after five first consecutive correct trials, between the recurrent session and the open-ended session.

Figure 6—figure supplement 3.

The classification of subjects is based on the model prediction (for Experiment 1). The difference between the two distributions is statistically significant (a Kolmogorov-Smirnov test gives p=310-4).