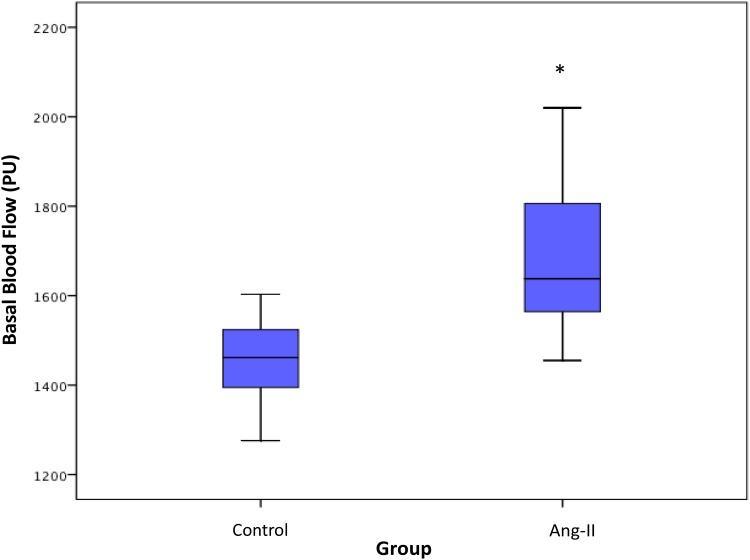
Figure 3.
Basal blood-flow in control and Ang-II-treated mice. Data are presented as box plots. The three horizontal lines in the boxes are the 25th, 50th and 75th percentiles. The two lines outside the boxes represent the highest and lowest values. PU: perfusion unit. Asterisk indicates significant blood-flow differences at p < 0.05 level between control and Ang-II-treated mice.

