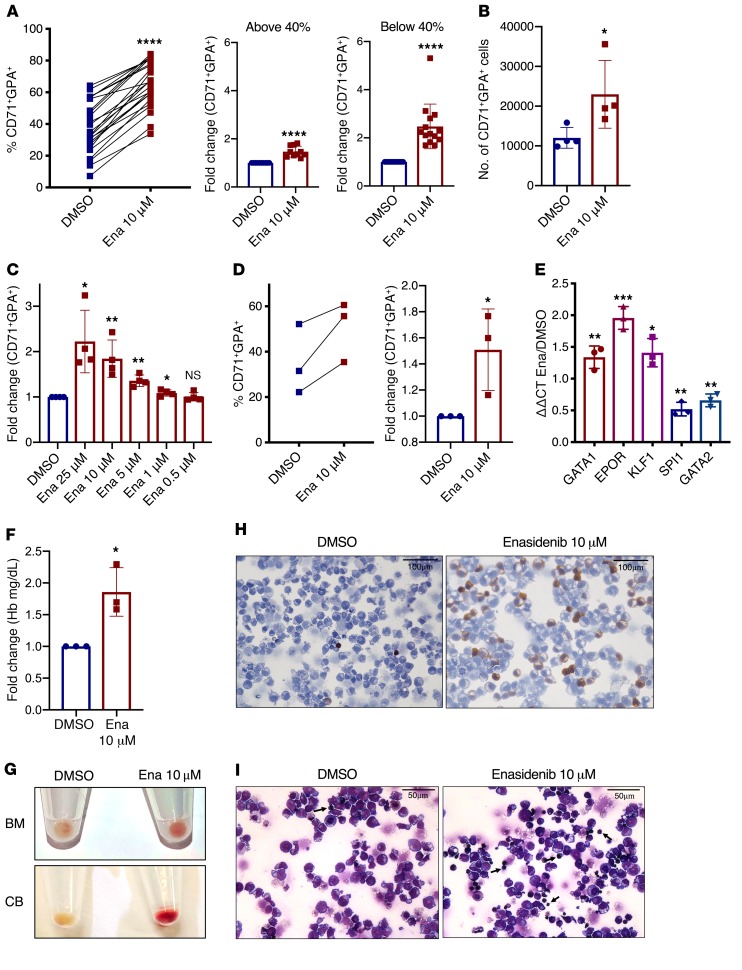
Figure 1. Enasidenib augments erythroid differentiation.
(A) Proportion of CD71+GPA+ (%CD71+GPA+) cells after 8 days culture of CB-CD34+ cells in EDC with DMSO or 10 μM enasidenib (Ena) (left; n = 24 independent CB specimens). Fold change (FC) of percentage of CD71+GPA+ cells (DMSO = 1) cells with baseline differentiation capacity (%CD71+GPA+) of less than 40% (right; n = 14) or greater than 40% (middle; n = 10). (B) Number of CB-derived CD71+GPA+ cells at day 8 of EDC (n = 4). (C) Dose response of enasidenib, represented as FC of percentage of CD71+GPA+ cells (DMSO = 1) at day 8 of EDC (n = 4). (D) Proportion of CD71+GPA+ cells at day 8 of EDC of CD34+ cells from normal bone marrow (BM) (left; n = 3). FC of percentage of CD71+GPA+ cells (DMSO = 1) (right; n = 3). (E) qPCR detection of relative RNA expression of erythroid and myeloid transcription factors with enasidenib treatment compared with DMSO of CB-CD34+ cells at day 8 of EDC (DMSO = 1) (n = 3). (F) FC of hemoglobin in a colorimetric assay after 14 days in EDC (DMSO=1) (n = 3). (G) Representative cell pellets from normal BM (top panel) and CB (bottom panel) after 14 days in EDC (n = 3). (H) Representative image at day 8 of CB-CD34+ cells in EDC treated with DMSO or 10 μM enasidenib (n = 3) and stained with benzidine. (I) Representative image at day 8 of CB-CD34+ cells in EDC treated with DMSO or 10 μM enasidenib (n = 3) and stained with Wright-Giemsa. Arrows indicate maturing erythrocytes. Graphs represent mean ± SD. Statistical significance was calculated using unpaired 2-tailed t tests. *P < 0.05, **P < 0.01, ***P < 0.001, ****P < 0.0001.

