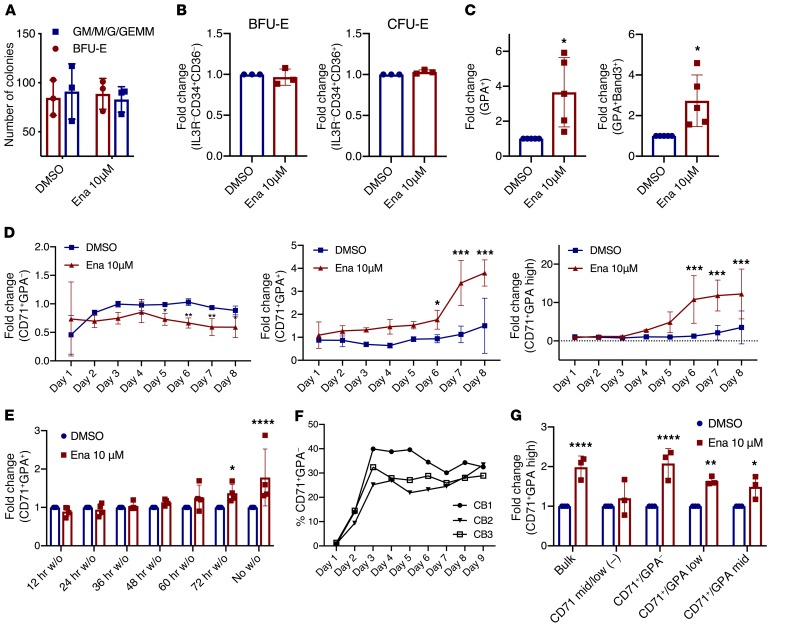
Figure 3. Enasidenib acts on mature CD71+ erythroid progenitors to increase differentiation.
(A) Methylcellulose colony forming assay of CB-CD34+ cells indicating the number of erythroid colonies (BFU-E) and myeloid colonies (GM/M/GEMM) observed with DMSO or enasidenib treatment after 14 days (n = 3). (B) FC of percentage of BFU-E (IL3R–CD34+CD36–) (middle) and percentage of CFU-E (IL3R–CD34–CD36+) (right) at day 4 of EDC (DMSO = 1) (n = 3). (C) FC of percentage of GPA+ (left) and percentage of GPA+Band3+ (right) at day 8 of EDC (DMSO = 1) (n = 3). (D) Time course of erythroid differentiation: FC of percentage of CD71+GPA– (left), percentage of CD71+GPA+ (middle), and percentage of CD71+GPA-high (right) relative to untreated cells (not shown) (n = 3). (E) FC of percentage of CD71+GPA+ measured at day 8 of EDC, with DMSO or enasidenib washed out (w/o) of the culture at the indicated time points (DMSO = 1) (n = 4). (F) Timeline of the gain of CD71 expression (%CD71+GPA–) in 3 untreated CB samples. (G) Cells were sorted into CD71 mid/low, CD71+GPA–, CD71+GPA-low, and CD71+GPA-mid after 6 days of EDC, and then treated with DMSO or enasidenib for 4 days. FC of percentage of CD71+GPA-high (DMSO for each population = 1) (n = 3). Graphs represent mean ± SD. Statistical significance was calculated using unpaired 2-tailed t tests. *P < 0.05, **P < 0.01, ***P < 0.001, ****P <0.0001.

