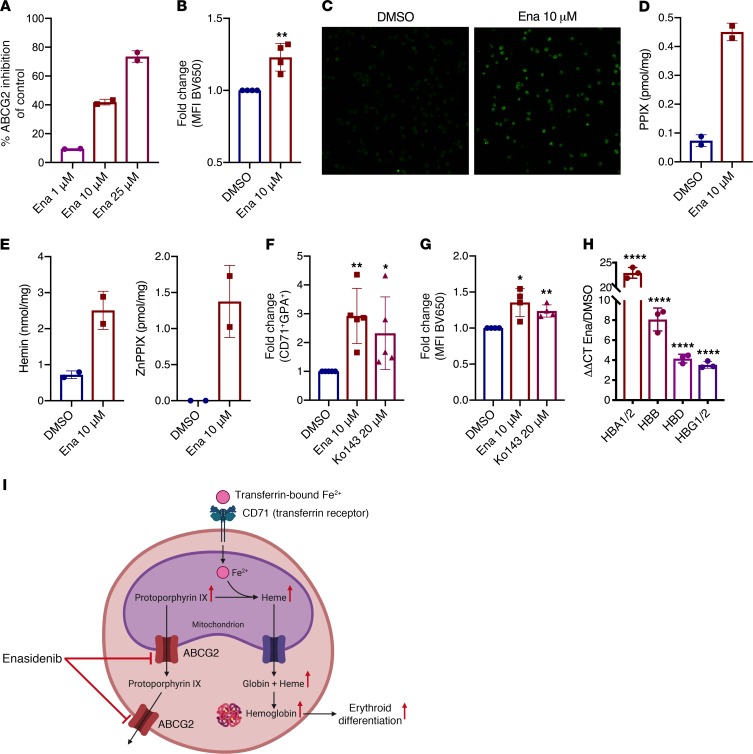
Figure 4. Enasidenib modulates heme biosynthesis through accumulation of PPIX.
(A) Enasidenib-mediated inhibition of ABCG2-mediated Hoechst efflux in CHO cells, measured in duplicate, as percentage of inhibition relative to DMSO control. (B) FC of MFI measuring PPIX fluorescence by flow cytometry (BV650 channel) in CB-CD34+-derived cells at D8 of EDC (DMSO = 1) (n = 4). (C) Representative microscopy image of PPIX (HeNe 633 laser, original magnification ×20) in CB-CD34+-derived cells at day 8 of EDC (n = 3). (D) UPLC levels of PPIX after 8 days of enasidenib treatment. For D and E, each point represents 3 independent CB-CD34+ samples that were pooled together before metabolite measurement. (E) UPLC levels of hemin and ZnPPIX after 8 days of enasidenib treatment. (F) FC of percentage of CD71+GPA+ cells at day 8 of EDC after treatment with enasidenib or Ko143 (DMSO = 1) (n = 5). (G) FC of MFI measuring PPIX fluorescence by flow cytometry (BV650 channel) in CB-CD34+-derived cells at day 8 of EDC with enasidenib or Ko143 (DMSO = 1) (n = 4). (H) qPCR determination of relative RNA expression of hemoglobin genes in enasidenib-treated CB-CD34+-derived cells at day 8 of EDC (DMSO = 1) (n = 3). (I) Schematic of proposed model. Graphs represent mean ± SD. Statistical significance was calculated using unpaired 2-tailed t tests. *P < 0.05, **P < 0.01, ****P < 0.0001.

