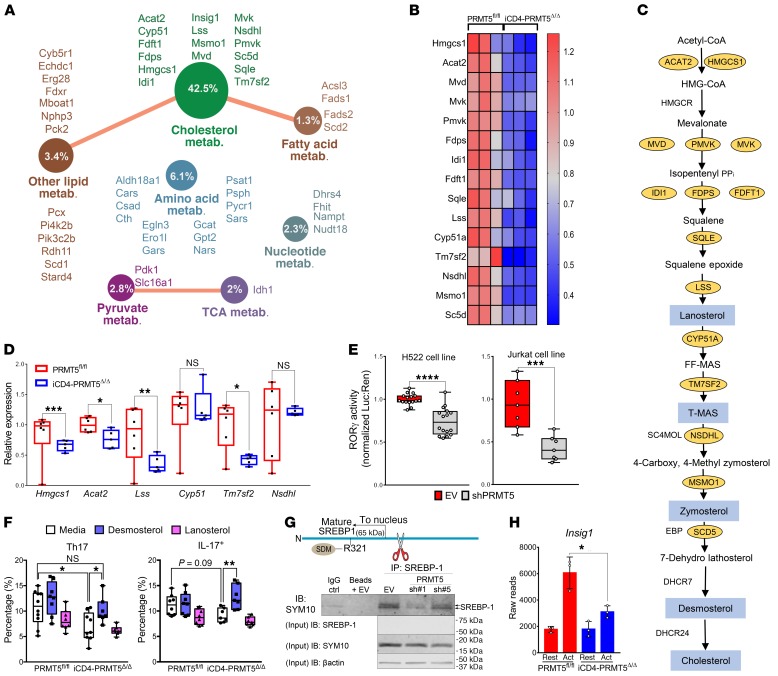
Figure 5. PRMT5 promotes Th17 differentiation via cholesterol biosynthesis.
(A) GO analysis of downregulated (FDR ≤ 0.05) genes in 2-day anti-CD3/CD28–activated CD4+ T cells from iCD4-PRMT5Δ/Δ versus PRMT5fl/fl mice (n = 3 each), revealing effect on metabolic genes. Circle indicates percentage of genes within pathway reduced in iCD4-PRMT5Δ/Δ T cells. (B) Heatmap of cholesterol biosynthesis enzymes differentially expressed in T cells from A (FC = 0–1.3). (C) Cholesterol biosynthesis pathway. Yellow ovals: enzymes significantly decreased in iCD4-PRMT5Δ/Δ T cells from B; blue: cholesterol precursors with RORγt agonistic activity. (D) Real-time PCR of cholesterol biosynthesis pathway enzyme expression 2 days after activation of iCD4-PRMT5Δ/Δ or control Th cells in Th17-polarizing conditions. Three independent experiments (n = 5–6). (E) RORγt luciferase activity using the RORγt-GAL4 luciferase/Renilla-normalized reporter, in human H522 and Jurkat T cells transduced with empty vector control (EV) or PRMT5 shRNA (90%–94% knockdown in H522; 70%–75% in Jurkats). Data pooled from 3 independent experiments (n = 2–6). (F) iCD4-PRMT5Δ/Δ naive CD4+ T cells activated in Th17-polarizing conditions with and without cholesterol precursor desmosterol or lanosterol. Flow cytometric analysis of RORγt+IL-17+ or IL-17+ (gated on live CD4+CD44+) Th17 cells was performed 3 days after activation. Data pooled from 2 independent experiments (n = 5). (G) Diagram and IP of mature SREBP1 including PRMT5 methylation site. After cleavage, mature transcript translocates to nucleus for transcriptional activity. Anti-SREBP1 IP, then IB of SYM10 in Jurkats transduced with EV or PRMT5 shRNA as in E. IB represents 2 to 3 independent experiments (n = 3). (H) Differential expression reads for SREBP target Insig-1 in naive, resting, or activated (CD3/CD28, Th17 conditions) CD4+ T cells from iCD4-PRMT5Δ/Δ or control mice (n = 3). Student’s t test (D, E, and H) or 2-way ANOVA, followed by Dunnett’s (within genotypes) or Sidak’s (across genotypes) multiple-comparisons test (F). *P < 0.05, **P < 0.01, ***P < 0.001, ****P < 0.0001. Box-and-whisker plots (points = max to min, line = median, box = 25th–75th percentiles). Bar graphs display mean ± SD.

