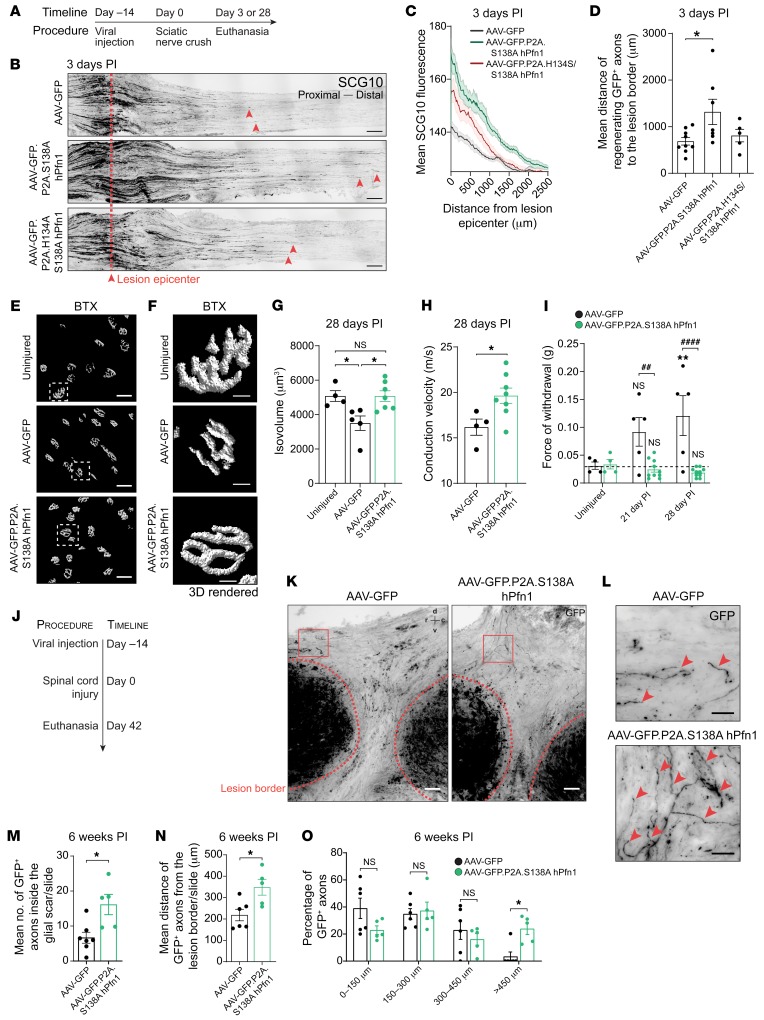
Figure 6. In vivo delivery of S138A hPfn1 elicits regeneration of peripheral and CNS axons.
(A) Strategy to assess peripheral regeneration following viral delivery of S138A hPfn1. (B) SCG10 staining of longitudinal sciatic nerve sections at 3 days postinjury (PI); red dashed lines indicate the lesion epicenter, red arrowheads highlight regenerating axons. Scale bars: 200 μm. (C) SCG10 fluorescence versus distance to lesion epicenter. (D) Mean distance of GFP+ sciatic nerve axons regenerating distally to the lesion edge 3 days PI. Data represent mean ± SEM (n = 5–9 animals/condition). *P < 0.05 by 1-way ANOVA with Tukey’s post hoc test. (E) 3D surface–rendered reconstructions, (F) zoom-in of E, and (G) volume quantification of NMJs fluorescently labeled with α-bungarotoxin (BTX), 28 days PI. Scale bars: 50 μm (E) and 10 μm (F). (H) Motor nerve conduction velocity, 28 days PI. In G and H, data represent mean ± SEM (n = 4–8 animals/condition). *P < 0.05 by Student’s t test. NS, not significant. (I) von Frey hair test, 21 and 28 days PI. Data represent mean ± SEM (n = 5–10 animals/condition). **P < 0.01; NS, not significant related to AAV-GFP uninjured condition. ##P < 0.01, ####P < 0.0001 refers to AAV-GFP versus AAV-GFP.P2A.S138A hPfn1 animals; both by 2-way ANOVA with Sidak’s post hoc test. (J) Strategy to assess CNS regeneration following delivery of AAV-GFP and AAV-GFP.P2A.S138A hPfn1. (K) Injured spinal cords 6 weeks following transection. Scale bars: 100 μm. Red dashed line, lesion border; arrowheads, GFP+ axons within the lesion core; r, rostral; c, caudal; d, dorsal; v, ventral. (L) Zoom-ins of K. Scale bars: 40 μm. (M) Number of GFP+ axons regenerating within the glial scar. (N) Distance (rostral to caudal) of regenerating axons and (O) percentage of GFP+ axons at different distance ranges from the injury border. Data represent mean ± SEM (n = 5–7 animals/condition). *P < 0.05 by Student’s t test. NS, not significant.

