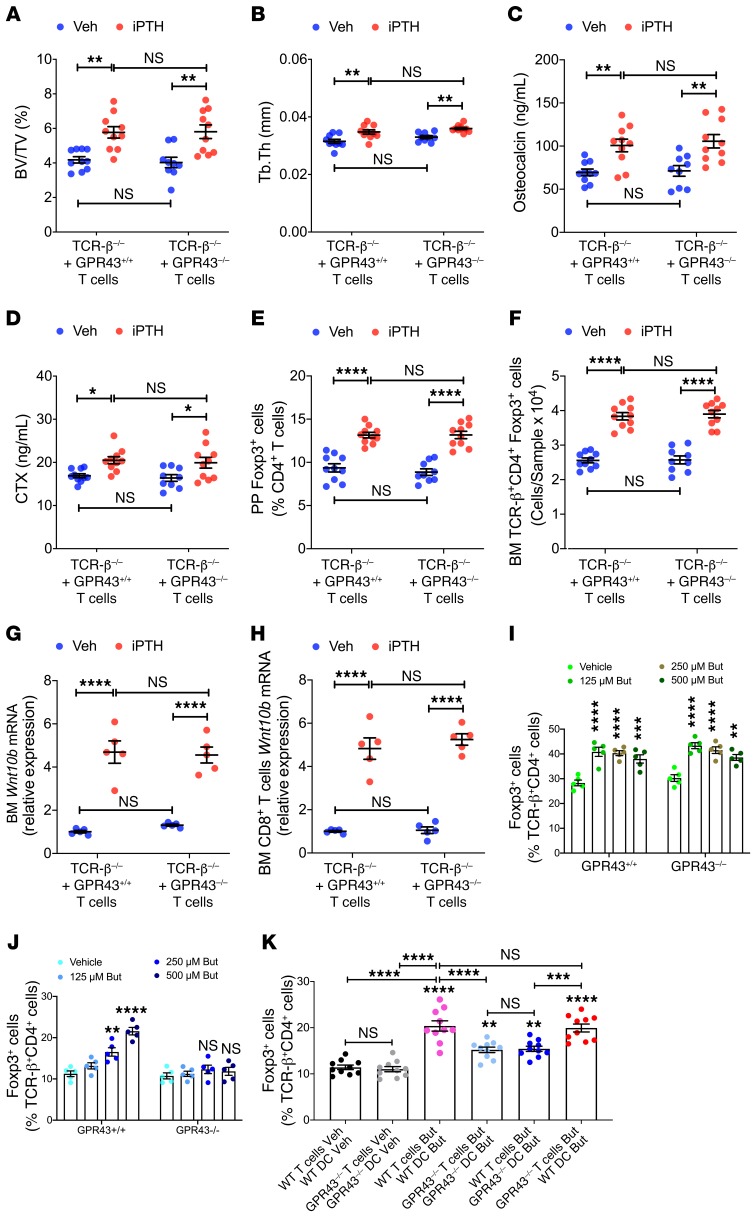
Figure 7. GPR43 signaling in DCs is required for iPTH treatment to improve trabecular structure, stimulate bone turnover, expand Tregs, and induce Wnt10b expression.
TCR-β–/– mice reconstituted with sorted splenic T cells from GPR43–/– or GPR43+/+ littermates were treated with either vehicle or iPTH for 4 weeks. Mice were sacrificed and analyzed at 12 weeks of age. (A and B) μCT scanning measurements of trabecular bone volume fraction (BV/TV) and trabecular thickness (Tb.Th) (n = 10 mice/group). (C and D) Serum levels of osteocalcin and CTX (n = 10 mice/group). (E and F) PP and BM Tregs (CD4+Foxp3+ cells) (n = 10 mice/group). (G and H) Wnt10b mRNA levels in whole BM cells and sorted BM CD8+ T cells (n = 5 mice/group). (I) Number of Tregs in cultures of naive CD4+ T cells from WT or GPR43–/– in the presence of butyrate (n = 5 /group). (J) Number of Tregs in cocultures of WT naive CD4+ T cells, and WT or GPR43–/– DCs pretreated with butyrate (n = 5/group). (K) Number of Tregs in cocultures in naive CD4+ T cells and DCs. WT and GPR43–/– mice were treated with antibiotics for 4 weeks and iPTH or butyrate during the last 2 weeks (n = 10/group, from 2 separate experiments). In I, the cultures were stimulated by anti-CD3 and anti-CD28 antibodies, IL-2, and TGF-β. In J–K, the cultures were stimulated by anti-CD3 antibody and TGF-β. Data were expressed as mean ± SEM. All data were normally distributed according to the Shapiro-Wilk normality test. Data in A–J were analyzed by 2-way ANOVA and post hoc tests, applying the Bonferroni’s correction for multiple comparisons. Data in K were analyzed by 1-way ANOVA and post hoc tests, applying Bonferroni’s correction for multiple comparisons *P < 0.05, **P < 0.01, ***P < 0.001, and ****P < 0.0001 compared with the indicated group in the post hoc tests.

