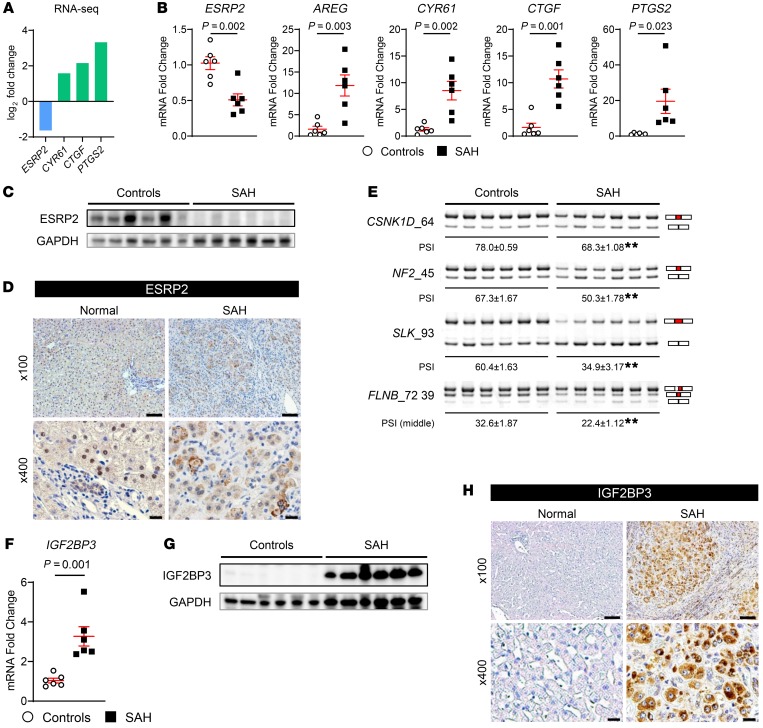
Figure 2. ESRP2 expression and ESRP2-mediated adult RNA-splicing program are downregulated in livers of patients with SAH.
(A) The log2 fold changes of ESRP2 and direct YAP/TAZ target genes (CYR61, CTGF, PTGS2) assessed by RNA-Seq in liver explants from SAH patients relative to healthy controls (n = 5 each). (B) Quantitative reverse transcription PCR (qRT-PCR) analysis for ESRP2 and YAP/TAZ target genes (AREG, CYR61, CTGF, PTGS2) in human SAH livers and healthy controls. (C) Immunoblots for ESRP2 normalized to GAPDH as a loading control in lysates of liver tissues from SAH patients and healthy controls. (D) IHC for ESRP2 in explanted liver tissues of SAH patients and healthy human liver. (E) Alternative splicing of ESRP2 target mRNAs including CSNK1D, NF2, SLK, and FLNB between liver tissues of SAH patients and healthy controls. Upper bands include the exon (red part), while the lower bands skip the exon. Exon lengths are shown beside the gene name, and the differences in PSI values are shown as mean ± SEM below each image. (F–H) qRT-PCR analysis (F), immunoblot (G), and IHC (H) for IGF2BP3 in the livers of SAH patients and healthy controls. qRT-PCR results are graphed as dot plots (SAH, black squares; healthy controls, white circles) showing mean ± SEM (red bars) (n = 5 individuals/group). See full, unedited blots for C and G and full, unedited gels for E in the supplemental material. Statistical analysis was performed by using 2-tailed Student’s t test between 2 groups (n = 5 individuals/group, P values are specified otherwise, **P < 0.001). Representative images are shown for IHC. Scale bars: 100 μm (original magnification, ×100), 20 μm (original magnification, ×400).

