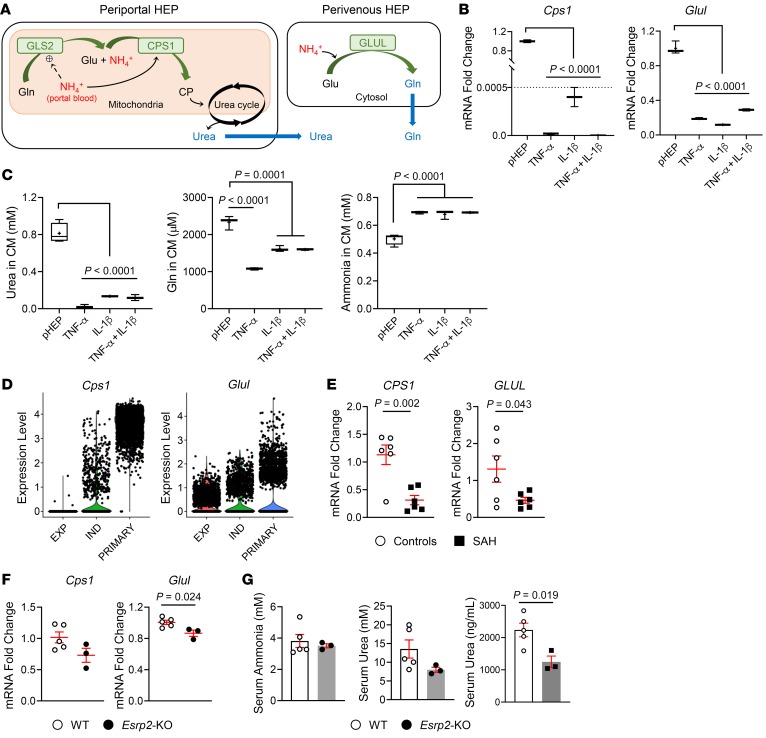
Figure 6. Fetal reprogrammed hepatocytes lose adult liver-specific functions.
(A) A schematic of ammonia (NH4+) detoxification pathway by hepatocytes in the liver. Glu, glutamate; Gln, glutamine; CP, carbamoyl phosphate. (B) qRT-PCR analysis for Cps1 and Glul in freshly isolated primary mouse hepatocytes and primary hepatocytes cultured under spheroid-forming system for 18 days continuously treated with TNF-α, IL-1β, or TNF-α + IL-1β. (C) The levels of urea, glutamine, and ammonia in conditioned medium of primary hepatocytes as specified. Results are graphed as box and whiskers plots (min to max), and means are indicated as plus signs. Statistical analysis was performed by 1-way ANOVA with Tukey’s corrections (n = 3 biological replicates/group). (D) scRNA-seq analysis for Cps1 and Glul in primary hepatocytes and hepatocyte spheroids under TNF-α–mediated expansion medium or TNF-α–withdrawn induction medium, as described in a previous publication (38). (E) qRT-PCR analysis for CPS1 and GLUL in human livers with SAH and healthy controls. Results are graphed as dot plots (SAH, black squares; healthy controls, white circles) showing mean ± SEM (red bars) (n = 5 individuals/group). Statistical analysis was performed by using 2-tailed Student’s t test between 2 groups. (F) qRT-PCR analysis for Cps1 and Glul in mouse livers from WT and Esrp2-KO mice at baseline. Results are graphed as dot plots (Esrp2-KO, black circles; WT, white circles) showing mean ± SEM (red bars) (n = 3–5 individuals/group). Statistical analysis was performed by using 2-tailed Student’s t test between 2 groups. (G) The serum levels of ammonia, urea, and albumin (ALB) in healthy WT and Esrp2-KO mice. Mean ± SEM results are graphed, and statistical analysis was performed by using 2-tailed Student’s t test between 2 groups (n = 3–5 mice/group).

