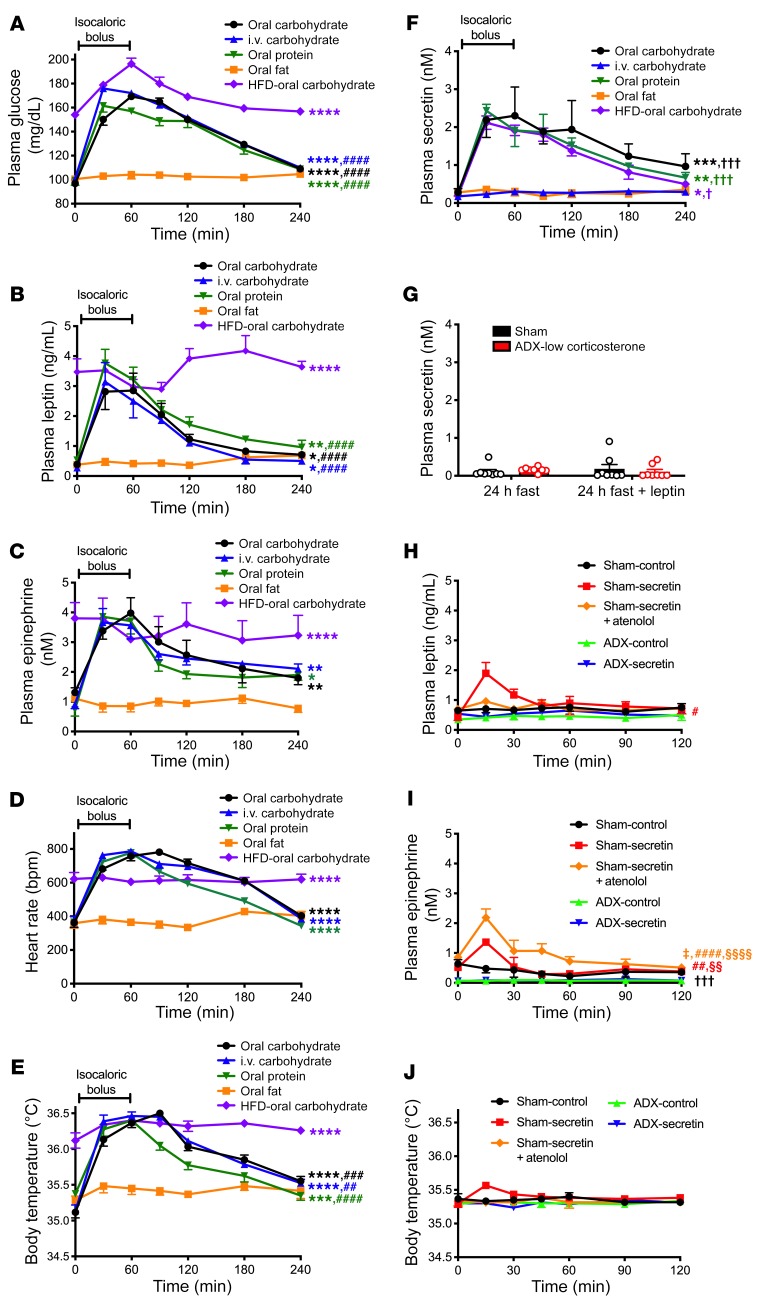
Figure 6. Increases in postprandial body temperature, but not energy expenditure, depend on meal composition; secretin has a modest, catecholamine-dependent effect of increasing temperature.
(A–C) Plasma glucose, leptin, and epinephrine concentrations after an isocaloric bolus of carbohydrate (dextrose), fat (canola oil), or protein (casein). (D and E) Heart rate and body temperature. (F) Plasma secretin. n = 8 per group. In A–F, n = 4 (oral protein), n = 5 (HFD–oral carbohydrate), n = 6 (oral carbohydrate, oral fat), and n = 8 (i.v. carbohydrate). AUC was compared by ANOVA with Bonferroni’s multiple-comparisons test. *P < 0.05, **P < 0.01, ***P < 0.001, ****P < 0.0001 vs. oral fat; ##P < 0.01, ###P < 0.001, ####P < 0.0001 vs. HFD–oral carbohydrate; †P < 0.05, †††P <0.01 vs. oral fat. (G) Plasma secretin in 24-hour-fasted sham-operated and ADX rats given 2% sucrose water. In G–J, n = 6–8 per group. (H and I) Plasma leptin and epinephrine concentrations in rats given an i.p. injection of secretin at time 0. #P < 0.05, ##P < 0.01, ####P < 0.0001 vs. ADX-control; §§P < 0.01, §§§§P < 0.0001 vs. ADX-secretin; †††P < 0.001 vs. sham-secretin+atenolol; ‡P < 0.05 vs. sham-secretin by ANOVA with Bonferroni’s multiple-comparisons test (comparison of AUC). (J) Body temperature. In all panels, data are presented as mean ± SEM. If no symbol appears, groups are not statistically different.

