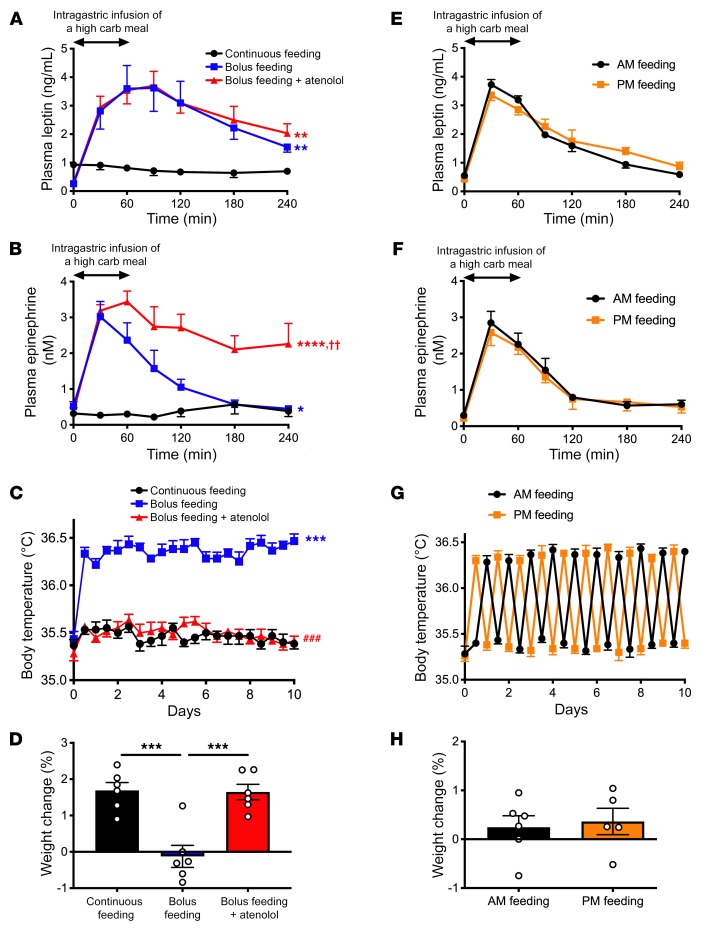
Figure 7. Bolus feeding minimizes weight gain through a β-adrenergic effect to increase body temperature.
(A and B) Plasma leptin and epinephrine concentrations during and after the last meal (day 10) or during continuous feeding (day 10). *P < 0.05, **P < 0.01, ****P < 0.0001 vs. continuous feeding; ††P < 0.01 vs. bolus feeding, comparing the AUC at 240 minutes by ANOVA with Bonferroni’s multiple-comparisons test. carb, carbohydrate. (C) Body temperature. ***P < 0.001 vs. continuous feeding; ###P < 0.001 vs. bolus feeding by ANOVA with Bonferroni’s multiple-comparisons test. (D) Weight change after 10 days. ***P < 0.001 by ANOVA with Bonferroni’s multiple-comparisons test. (E and F) Plasma leptin and epinephrine concentrations after the last meal on day 10 in rats fed once daily, either in the morning (AM) or evening (PM). In E–H, groups were compared by 2-tailed unpaired Student’s t test. n = 5 (PM feeding) and n = 6 (AM feeding). (G) Body temperature. (H) Weight change after 10 days. Data are presented as mean ± SEM. If no symbol appears, groups are not statistically different.

