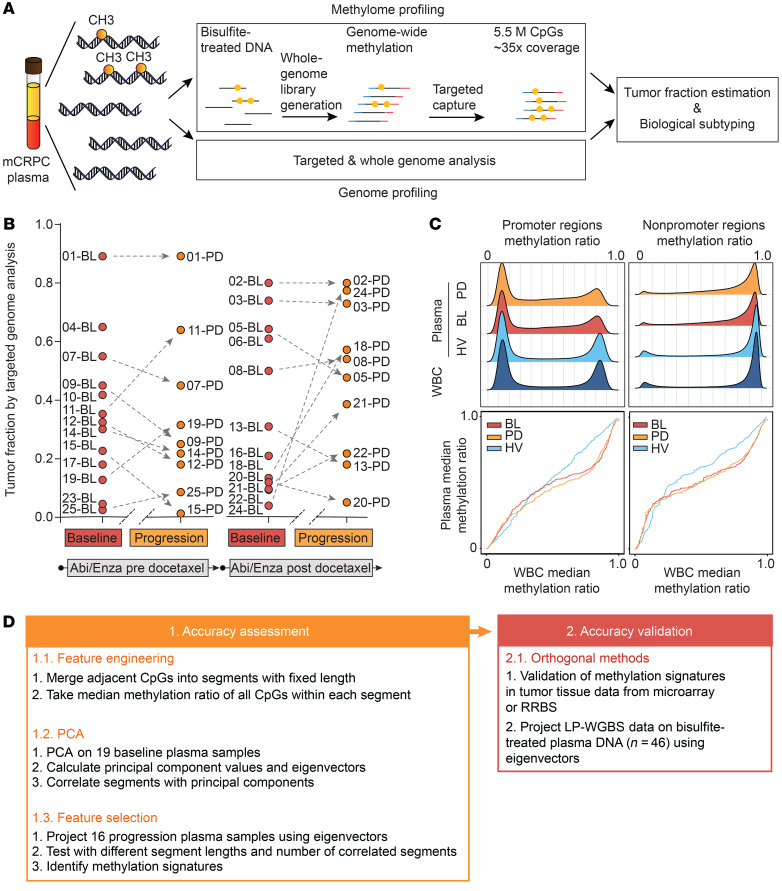
Figure 1. The mCRPC plasma methylome.
(A) Schematic overview of the workflow for integrating NGS of the plasma methylome and genome. (B) Genomically determined tumor fraction in baseline and progression samples from pre- and post-chemotherapy patients receiving abiraterone or enzalutamide. (C) Methylation ratio density (upper panel) and quantile-quantile plot (Q-Q plot, bottom panel) analysis based on the genomic annotation of methylation segments in promoter or other regions. Data from white blood cells (WBC) or plasma collected at baseline (BL) or progression (PD) from mCRPC patients or from healthy volunteers (HV) are presented separately. (D) Schematic workflow of methylation data analysis.

