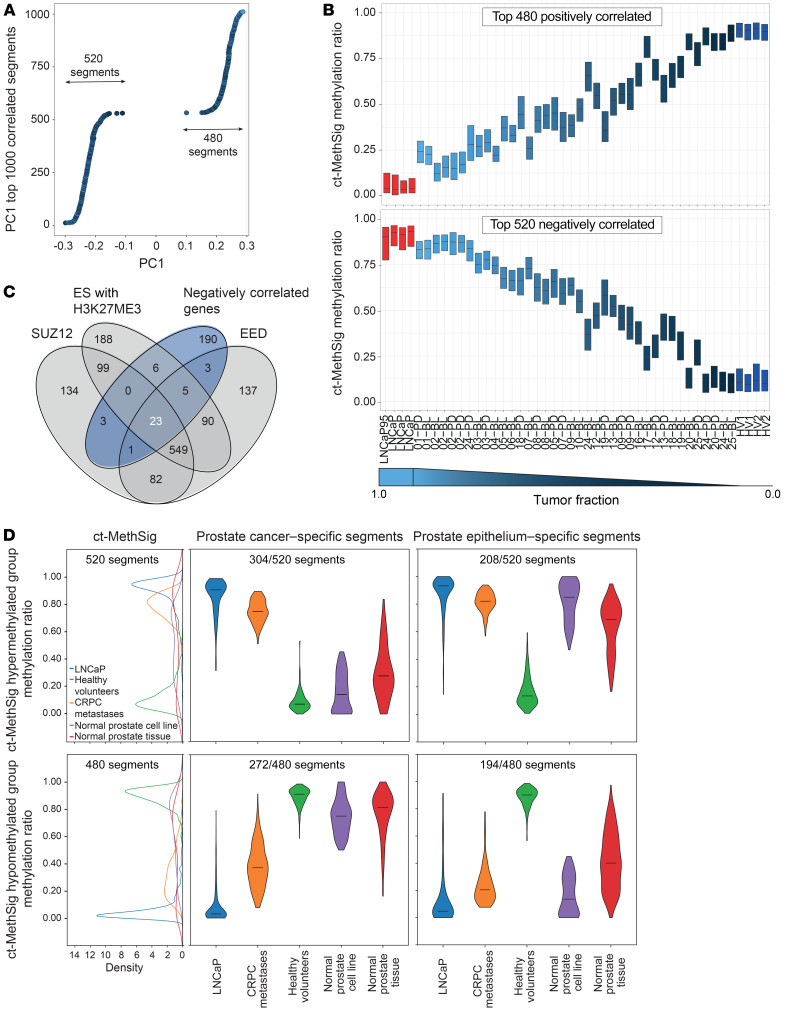
Figure 3. Methylation ratio across ct-MethSig can be a proxy for tumor fraction.
(A) Top 1000 segments (ct-MethSig) with the highest correlation coefficient between PC1 and methylation ratio. (B) ct-MethSig methylation ratio distribution by patient plasma sample split by negatively correlated and positively correlated segments. (C) Venn diagram showing the overlap of negatively correlated genes (dark blue) in ct-MethSig segments with targets of EED, SUZ12, and embryonic stem cells (ES) with H3K27ME3 marks. The number in white denotes the number of genes in the ct-MethSig negatively correlated group. (D) Circulating tumor fraction methylation signature comprises segments specific to either normal or malignant prostate epithelium. Left: Methylation ratios of ct-MethSig hypermethylated (n = 520) and hypomethylated (n = 480) groups from LNCaP (n = 4), healthy volunteers (n = 4), and normal prostate epithelium samples (PrEC). Right: The ct-MethSig hypermethylated and hypomethylated groups can be split into prostate cancer–specific segments and prostate epithelium–specific segments.

