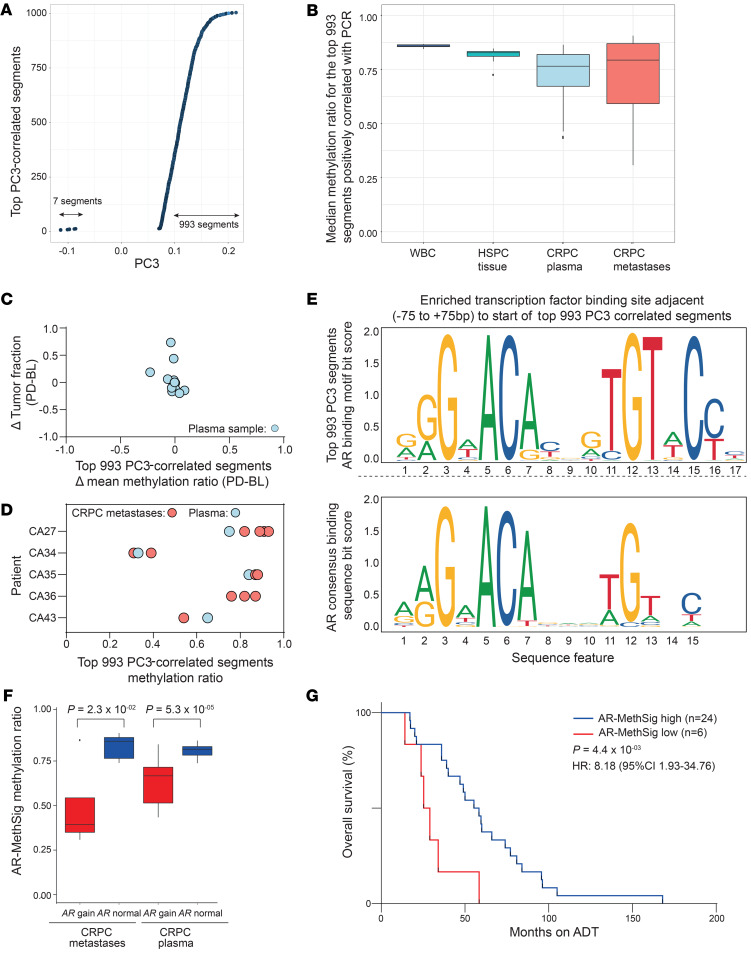
Figure 4. Methylation signatures that could allow subgrouping of mCRPC.
(A) Top 1000 segments with the highest correlation coefficient between PC3 and methylation ratio. (B) Methylation ratio of top 1000 segments highly correlated with PC3 values derived from plasma, white blood cell, HSPC tumor, and CRPC tumor (CASCADE trial). (C) Comparison of intraindividual changes in the top-correlated segments defined by targeted methylation NGS on plasma DNA and changes in tumor fraction. The y axis denotes the difference (Δ) of mean methylation ratio of the top-correlated segments between baseline and progression samples and the x axis denotes the difference in tumor fraction. (D) Median methylation ratio of the top-correlated segments of different metastatic sites by patient from the CASCADE rapid warm autopsy program. (E) AR binding motif that is overrepresented in regions adjacent to the top correlated segments (top). The consensus AR binding motif is shown as a reference (bottom). (F) Methylation ratio of AR-MethSig segments of AR gain group (CRPC metastases n = 5, CRPC plasma n = 18) and nongain group (CRPC metastases n = 8, CRPC plasma n = 17; Mann-Whitney U test). (G) Overall survival analysis (start of ADT to death) for AR-MethSig low group versus AR-MethSig high group (Mantel-Cox log-rank test).

