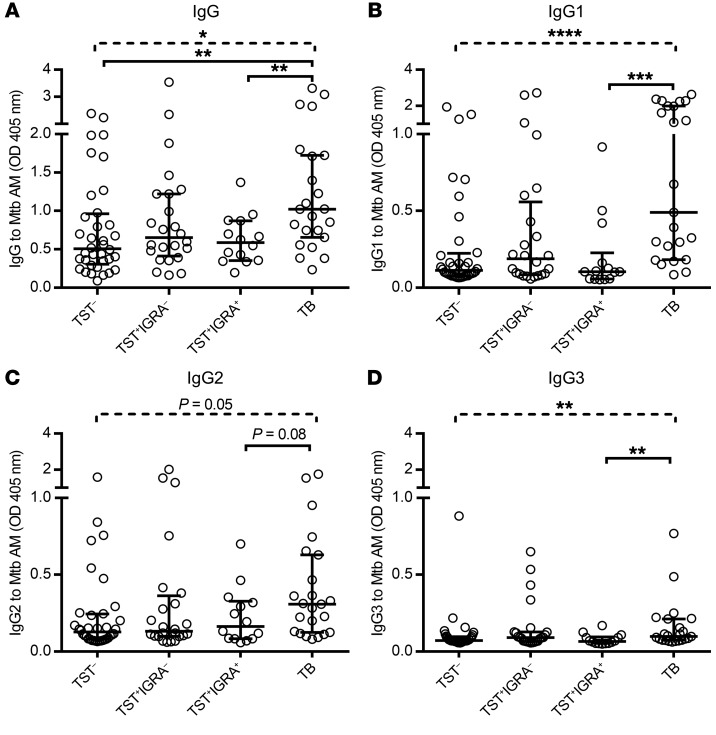
Figure 1. Wide range of IgG responses to Mtb (H37Rv) capsular AM at various stages of human Mtb infection.
Comparison of anti-AM IgG (A) and IgG subclasses 1–3 (B–D) between sera (1:50) from asymptomatic subjects: TST– (n = 36), TST+IGRA– (n = 24), TST+IGRA+ (n = 14), and symptomatic TB patients (n = 23). Dashed lines represent Kruskal-Wallis test. Solid lines represent Mann-Whitney U test. Two-group comparisons for IgG subclasses contrast TST+IGRA+ versus TB. Lines and error bars represent medians with interquartile ranges (IQRs). *P < 0.05, **P < 0.01, ***P < 0.001, ****P < 0.0001. TB, active tuberculosis.

