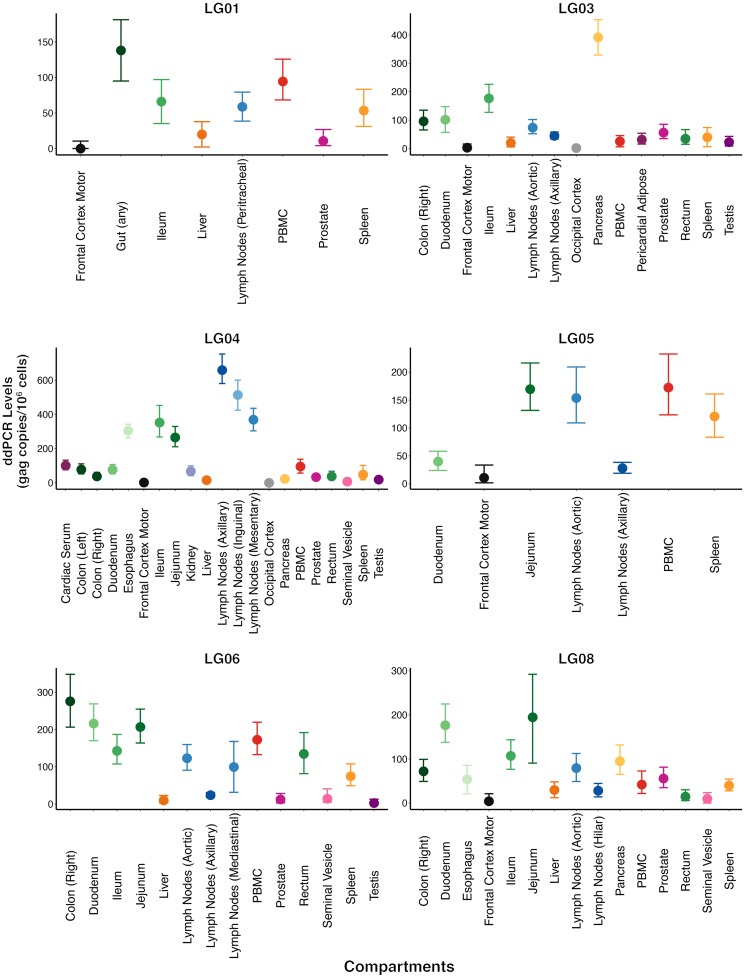
Figure 3. HIV DNA levels in compartments for each participant.
HIV DNA levels were quantified by ddPCR. Copy numbers were calculated as the mean of 3 replicate PCR measurements and normalized to 1 million cells, as determined by RPP30 assay (total cell count) (94, 95). See Methods for details. The dots and horizontal bars represent the mean and range (minimum and maximum) of the HIV DNA levels.

