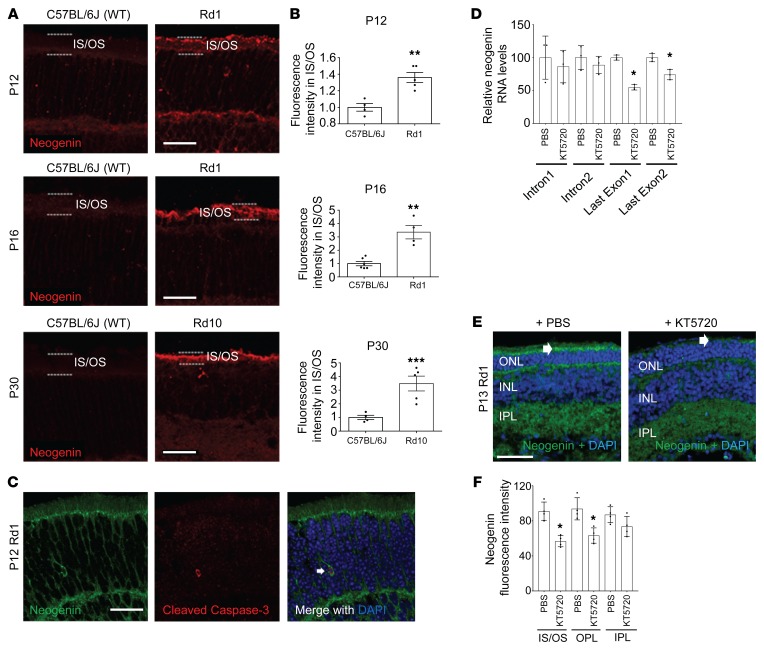
Figure 3. Elevated neogenin expression in Rd1 and Rd10 photoreceptors.
(A) Representative images of cryosectioned C57BL/6J (WT) retina, and Rd1 or Rd10 retina immunostained for neogenin (red) on P12, P16, or P30. Dashed lines indicate border of the IS/OS. Scale bars: 30 μm. All images were taken under identical conditions/settings. (B) Quantification of data from A. Neogenin intensity levels were significantly increased in the IS/OS of P12/P16 Rd1 and P30 Rd10 when compared with WT mice of the same age. P12: n = 4 and n = 5; P16 n = 4 and n = 5; P30 n = 6 and n = 4. **P < 0.01, ***P < 0.001. Significance determined by Student’s t test. (C) Representative image of a P12 Rd1 ONL demonstrating coexpression of neogenin (green) and cleaved caspase-3 (red) in the same cell (white arrows). Nuclear stain appears in blue (DAPI). Scale bar: 20 μm. (D–F) PKA inhibitor KT5720 suppresses neogenin expression in Rd1 retinal photoreceptor segments. P12 Rd1 mice received an intravitreal injection of either 4 mM KT5720 or PBS and were harvested on P13 for analysis. (D) Real-time PCR of intron 1, intron 2, and the last exon of neogenin from the indicated treatments (n = 3; *P < 0.05). Significance determined by Student’s t test. (E) Nuclear (DAPI, blue) and neogenin (green) staining of retinal sections from the indicated treatments. Scale bar: 50 μm. White arrows indicate neogenin in IS/OS. OPL, outer plexiform layer. (F) Quantification of data from E. Significance determined by Student’s t test (n = 4 for each; *P < 0.05).

