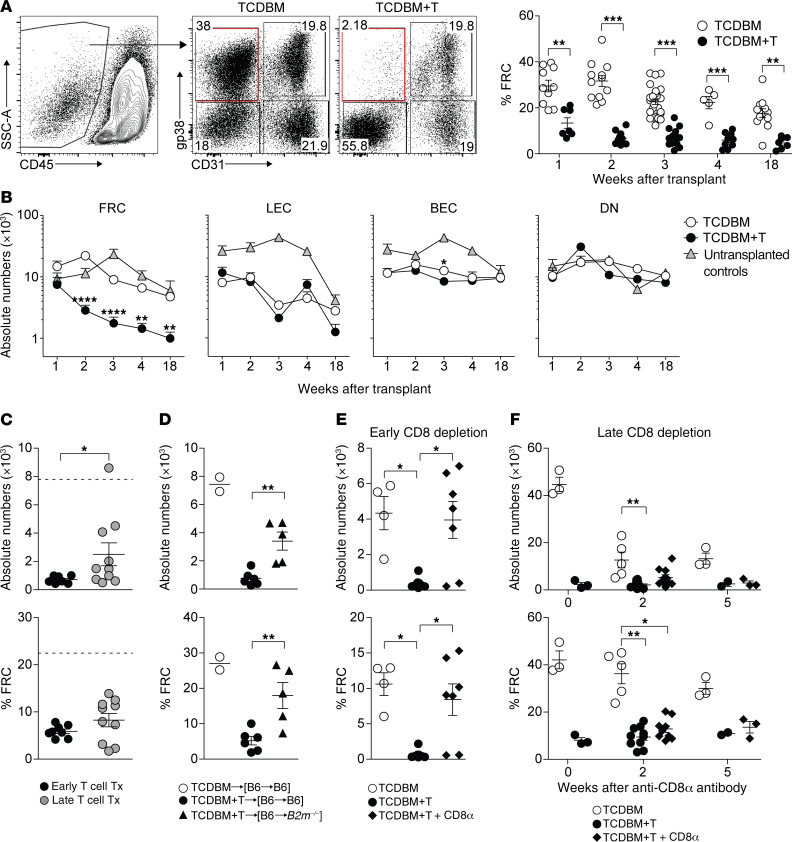
Figure 2. The extent and duration of FRC network injury affect its capacity for regeneration.
(A) LN stromal cells were analyzed at indicated time points after allo-BMT using the gating strategy shown. Frequencies of FRCs among CD45– LN stromal cells are shown at indicated time points after BMT in TCDBM and TCDBM+T recipients. (B) Absolute cell numbers of LN stromal cell subsets at indicated time points after F→M BMT with either TCDBM alone or TCDBM+T. Untransplanted, age-matched mice were used as controls (data derived from 10 independent experiments). (C) Absolute numbers (top) and frequencies (bottom) of FRCs at 3 weeks following transplantation in F→M BMT receiving Mh T cells either on day 0 (early) or 7 (late) after BMT. Dotted line indicates FRC numbers or frequencies measured in control recipients (data are representative of 3 independent experiments). (D) FRC frequencies and absolute numbers following second BMT and transfer of Mh T cells to [B6 male→B2m–/– male] versus [B6 male→B6 male] BM chimeras. Plots show absolute numbers (top) and frequencies (bottom) of FRCs among CD45– LN stromal cells (data are representative of 2 independent experiments). (E) Absolute numbers (top) and frequencies (bottom) of FRCs in recipients that either received TCDBM alone or TCDBM+T with or without early anti-CD8α antibody given twice weekly. LN stromal cells were analyzed on day 28 after transplantation, (F) Absolute numbers (top) and frequencies (bottom) of FRCs in recipients that either received TCDBM alone or TCDBM+T with or without late (from day 14) anti-CD8α antibody to deplete donor CD8+ T cells. LN stromal cells were analyzed at indicated time points following the start of anti-CD8α treatment (data derived from 2 independent experiments). Data represent mean ± SEM. *P < 0.05; **P < 0.01; ***P < 0.001; ****P < 0.0001 by Mann-Whitney U test (A and C) or Kruskal-Wallis ANOVA (B and D–F).

