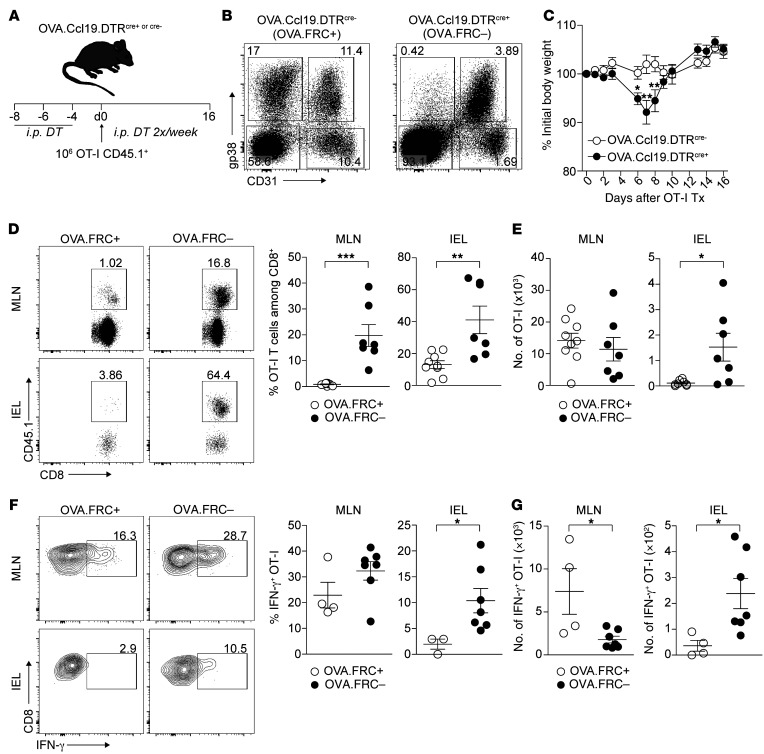
Figure 6. Specific depletion of FRCs is sufficient to break peripheral tolerance of autoreactive T cells in steady state.
(A) OVA.Ccl19.DTRcre+ and cre– mice received 500 ng DT i.p. on days –8, –6, and –4. OT-I T cells (1 × 10⁶) were transferred on day 0 and mice were analyzed on day 16. (B) FRC depletion in OVA.Ccl19.DTRcre+ versus cre– mice upon DT treatment. Flow cytometry plots depict surface expression of gp38 and CD31 among CD45– LN stromal cells. (C) Weight change in OVA.Ccl19.DTRcre+ and cre– mice is shown as percentage of initial body weight (defined as time point of OT-I transfer; data derived from 4 independent experiments). (D) OT-I T cells were identified as CD8+CD45.1+. Percentages of OT-I T cells are shown for MLNs and the IEL and summarized in dot plots (right). (E) Absolute numbers of OT-I T cells in MLNs and the IEL (data derived from 4 independent experiments). (F) IFN-γ secretion measured by intracellular flow cytometry. IFN-γ expression is shown among CD8+CD45.1+ OT-I T cells. Percentage of IFN-γ+ OT-I T cells in MLNs and the IEL is summarized in dot plots (right). (G) Absolute numbers of IFN-γ+ OT-I T cells in MLNs and the IEL (data derived from 3 independent experiments). Data represent mean ± SEM. *P < 0.05; **P < 0.01; ***P < 0.001 by Mann-Whitney U test.

