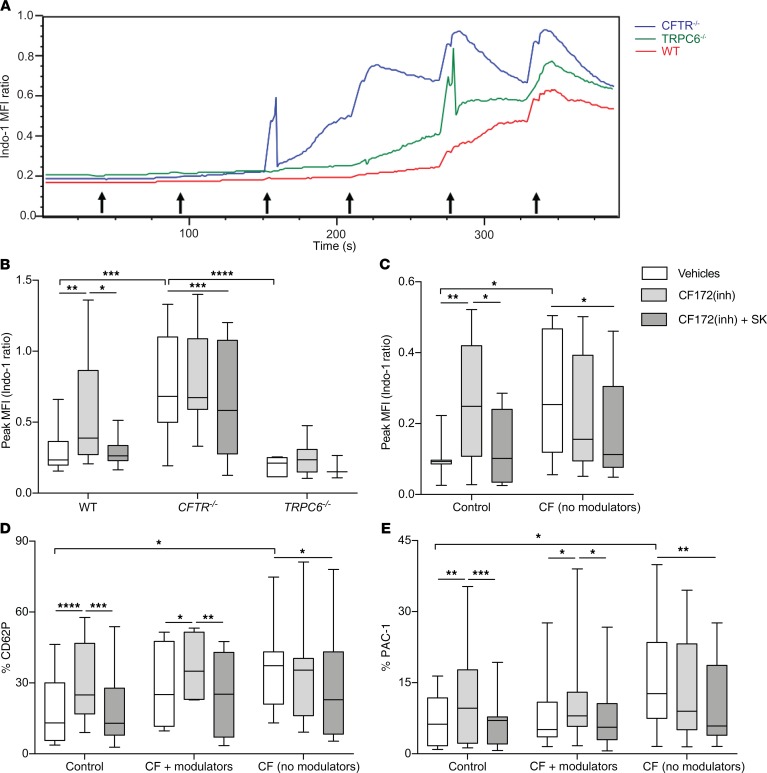
Figure 5. Calcium entry measured by the ratiometric Indo-1 assay in thrombin-stimulated platelets from mice and humans.
(A) Kinetic tracings of Indo-1 Violet/Blue MFI measured in platelets isolated from CFTR–/– (blue), TRPC6–/– (green), and WT (red) mice with 0.125 IU thrombin introduced at 60-second intervals starting at 30 seconds (black arrows). (B) Peak MFI in WT, CFTR–/–, and TRPC6–/– platelets incubated with vehicles, CF172, or CF172 plus SK. Data are mean ± SEM of 7 to 11 animals per group. (C) Peak MFI measured in platelets isolated from healthy human and CF subjects not on modulators incubated with vehicles, CF172, or CF172 plus SK. (D) CD62P and (E) PAC-1 expression in platelets from human controls, CF platelets plus modulators (lumacaftor/ivacaftor), and CF platelets not treated with modulators (no modulators). Data are presented as minimum-to-maximum whiskers and box plots showing the median and interquartile ranges. (C–E) n = 6–12 subjects per group. Data in B–E were analyzed by 2-way ANOVA. *P ≤ 0.05; **P ≤ 0.01; ***P ≤ 0.001; ****P ≤ 0.0001.

