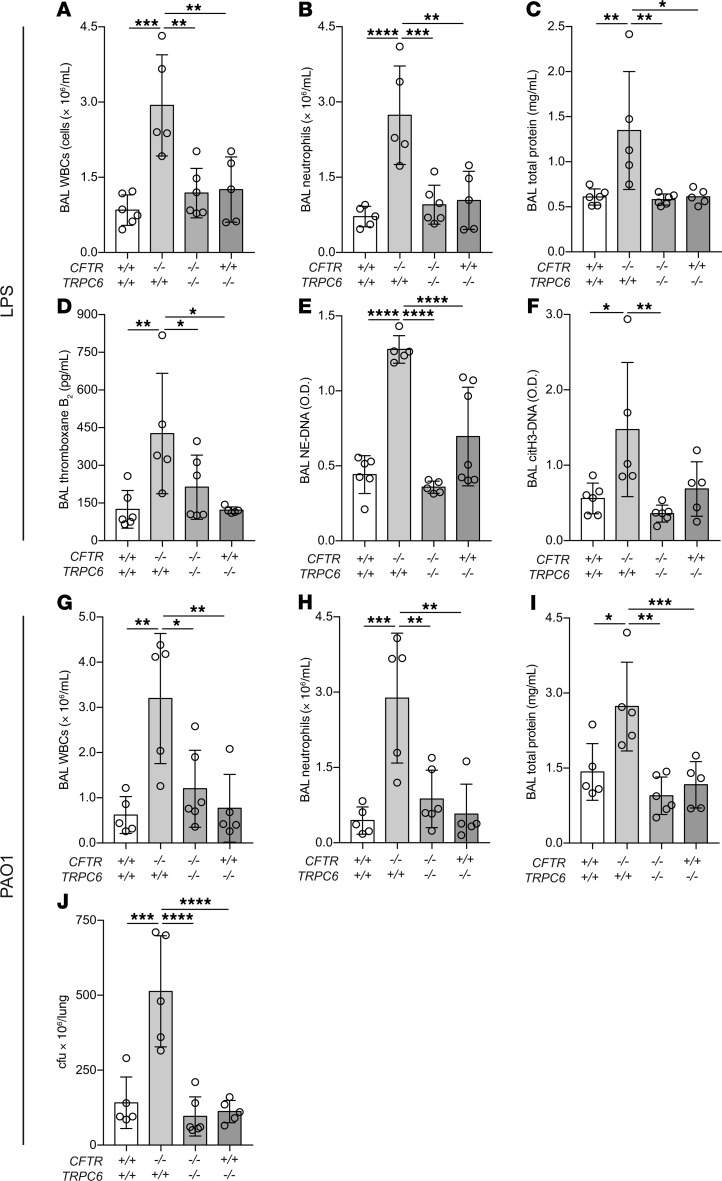
Figure 6. Lung injury measurements in CFTR and TRPC6 mutant mice after intratracheal LPS or PAO1.
(A) BAL WBCs, (B) neutrophils, (C) total protein, (D) thromboxane B2, (E) NETs (NE-DNA ELISA), and (F) NETs (citH3-DNA ELISA) in CFTR × TRPC6 mutant mice (genotypes indicated in x axis label). Data are mean ± SEM of 5 to 6 animals per group. Data were analyzed by 2-way ANOVA. *P ≤ 0.05; **P ≤ 0.01; ***P ≤ 0.001; ****P ≤ 0.0001. (G–J) Lung injury and bacterial counts after intratracheal PAO1. (G) BAL WBCs, (H) neutrophils, (I) total protein, and (J) lung colonies in CFTR and TRPC6 mutant mice. Data are mean ± SEM of 5 to 6 animals per group. Data were analyzed by 2-way ANOVA. *P ≤ 0.05; **P ≤ 0.01; ***P ≤ 0.001; ****P ≤ 0.0001.

