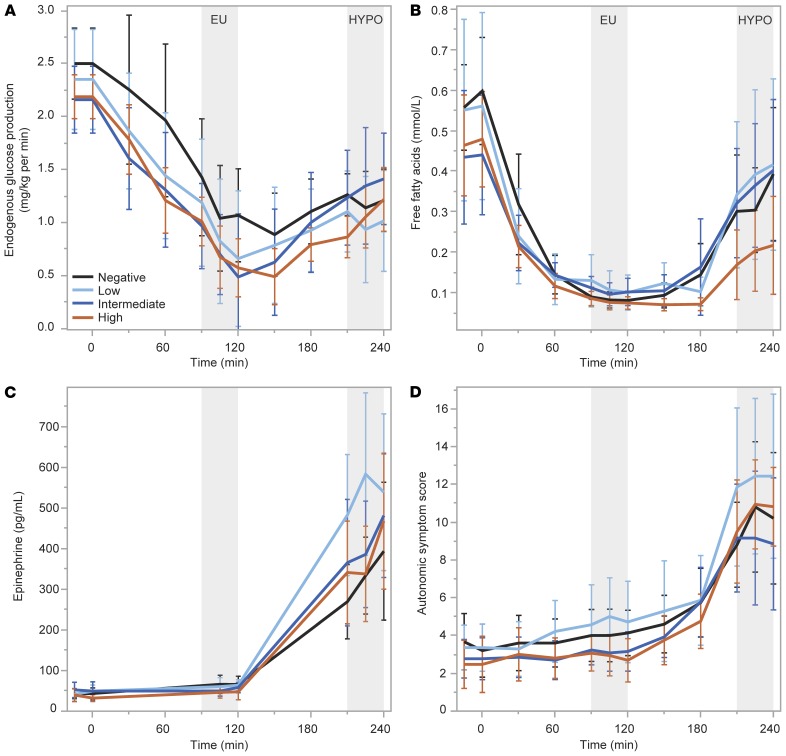
Figure 6. Glucose counterregulatory responses from the euglycemic (EU) to hypoglycemic (HYPO) clamp condition.
No differences were seen across groups based on MMTT peak C-peptide level for responses of counterregulatory endogenous glucose production (A), serum free fatty acids (B), plasma epinephrine (C), or autonomic symptom generation (D). Data are means with error bars denoting 95% CIs.

