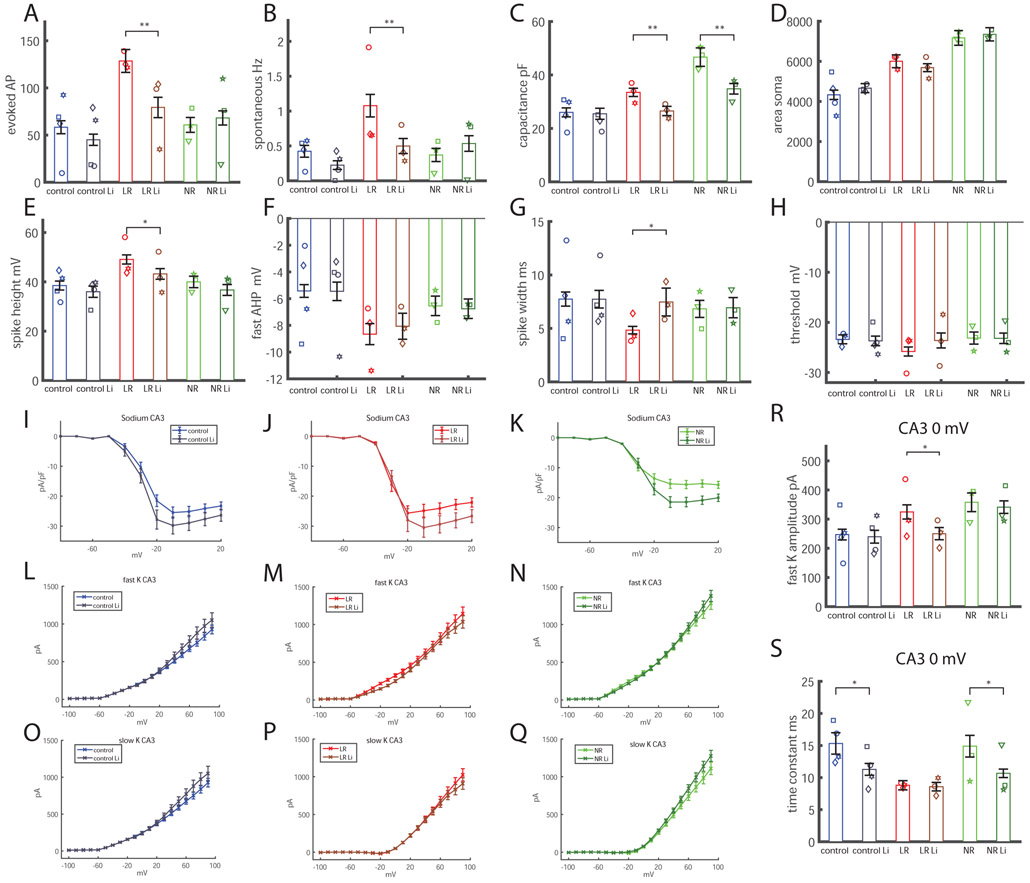
Figure 4.
Response to lithium treatment of CA3 neurons at t2. The total number of cells patched for this analysis was as follows: control, 49 neurons; control lithium (Li), 56 neurons; LR, 43 neurons; LR Li, neurons; NR, 71 neurons; NR Li, 65 neurons. A. Lithium treatment reduces the hyperexcitability (total number of evoked action potentials) of CA3 BD LR neurons. B. The spontaneous rate of action potentials is also reduced with lithium treatment in CA3 BD LR neurons. C. Similar to our previous report in DG neurons (14), the capacitance of BD LR and BD NR neurons is smaller with lithium treatment than the equivalent neurons grown without treatment. D. The soma of the BD LR and BD NR CA3 neurons did not decrease in size with lithium treatment, indicating that the reduction in capacitance with lithium treatment was due to a reduction in size of the neuritic tree. E. The spike height of BD LR CA3 neurons was reduced with lithium treatment. F. The fast AHP did not change with lithium treatment in any of the groups. G. The spike width broadened after lithium treatment in CA3 BD LR neurons. H. The threshold for evoking an action potential did not change in any of the 3 groups following lithium treatment. I. Lithium treatment increased normalized sodium currents in control CA3 neurons. J. Lithium treatment increased normalized sodium currents in BD LR CA3 neurons. K. Lithium treatment increased normalized sodium currents in BD NR CA3 neurons. L-Q. The fast and slow potassium currents did not change significantly (ANOVA). R. The amplitude of the fast potassium current at 0 mV was significantly decreased after lithium treatment in CA3 BD LR neurons. S. The decay time constant of the fast potassium current decreased (decay was faster) with lithium treatment in CA3 control and CA3 BD NR neurons. Each dot represents an average over the total number of patched cells for one human subject. Asterisks represent statistical significance by the following code: * p value<0.05, **p value<0.01. Error bars represent standard error.

