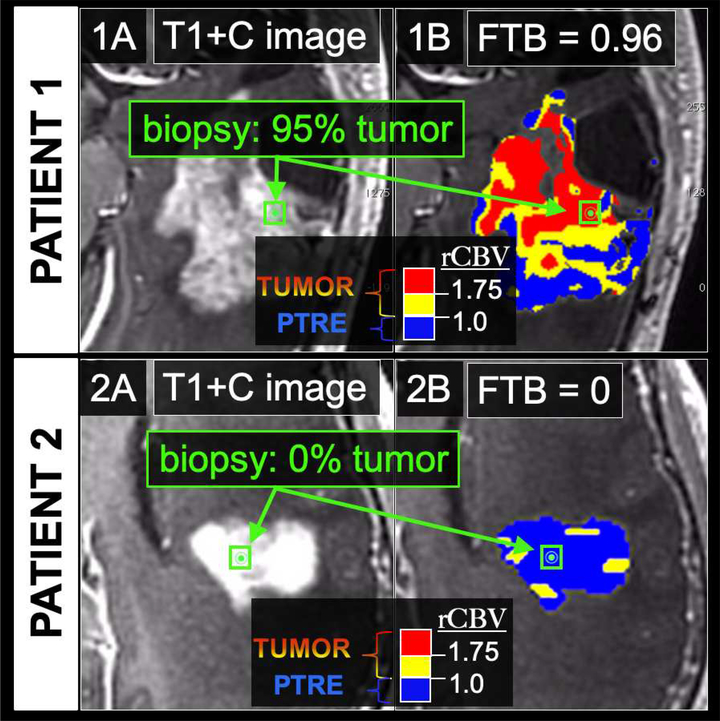
Figure 3: Two separate GBM patients status post standard adjuvant chemo-radiation therapy undergoing surgical biopsy for suspected recurrence.
In patient 1, (1A) T1+C images demonstrate a large heterogeneously enhancing mass concerning for tumor recurrence. The green dot depicts the stereotactic location of the biopsy specimen. (1B) On the coregistered FTB map, which is superimposed on the T1+C image, blue voxels correspond to predicted PTRE regions with low rCBV ≤ 1.0. The yellow (1.75 ≥ rCBV > 1.0) and red (rCBV > 1.75) voxels correspond to predicted tumor regions. The FTB metric is defined as the percentage of both yellow and red voxels relative to all voxels within the green ROI (green box) around the biopsy location (green dot). The FTB for the biopsy measured 0.96 (i.e., 96% of the voxels were predicted as tumor), which correlated with histologic quantification of 95% tumor from the spatially matched biopsy specimen. In patient 2, (2A) the T1+C image again demonstrates a large heterogeneous mass concerning for tumor recurrence. However, (2B) the FTB map shows an abundance of blue voxels consistent with predominant PTRE, with an FTB measurement of 0 (i.e., 0% of the voxels were predicted as tumor) within the ROI (green box) around the biopsy location (green dot). This correlated with the histologic findings of post-treatment effect, with no visible tumor within the spatially matched biopsy specimen.

