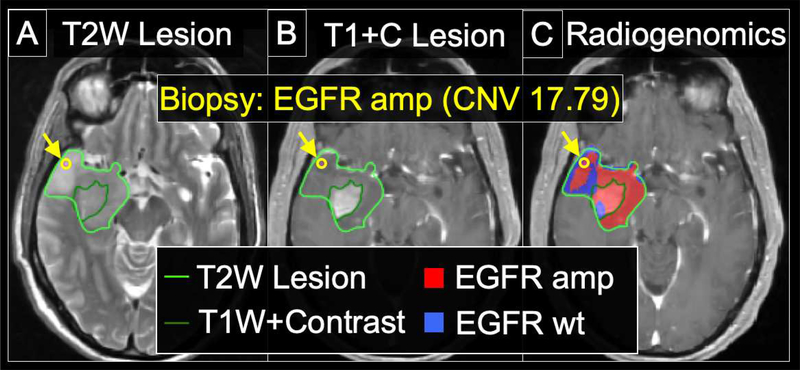
Figure 4: Radiogenomics map demarcating regions of amplification (amp) for Epidermal Growth Factor Receptor (EGFR) in a 63 y/o Male with primary GBM.
(A) The lesion is shown on the T2W image, with the margins demarcated by the bright green outline. The location of the biopsy (which was subsequently genetically profiled) is shown by the yellow arrow and yellow circle. (B) The central enhancing component is outlined by the dark green line on the T1+C image. The biopsy location (yellow arrow, yellow circle) is again shown, originating from the peripheral T2W non-enhancing component of tumor. (C) The radiogenomics map shows predicted regions of EGFR amplification (red) and non-amplified EGFR wildtype (wt) (blue), within the T2W region of interest (bright green outline) around the tumor. The radiogenomics map prediction of EGFR amplification (red) for the biopsy location corresponds with the elevated copy number variant (CNV) of 17.79, confirming EGFR amplification.

