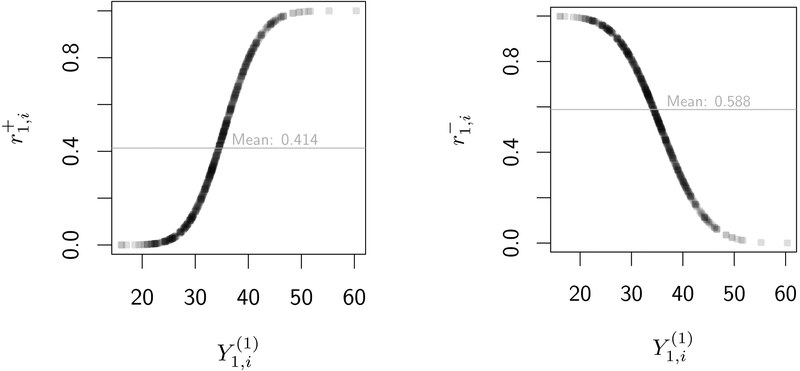
Figure C1:
Individual probabilities of response versus potential outcomes at the end of the first stage of a SMART under response models R+ and R−. Based on a simulated SMART with n = 500 individuals; a1 = 1 was chosen arbitrarily and without loss of generality. Empirical average response rate is plotted as a horizontal line in gray. Darker regions of the curve contain more observations.
(I) Response probabilities in the R+ model versus (II) Response probabilities in the R− model versus with average response rate r1 = 0.4. Higher val- with average response rate r1 = 0.6. Higher values of are associated with higher response prob- ues of are associated with lower response prob- ues of are associated with lower response probabilities.

