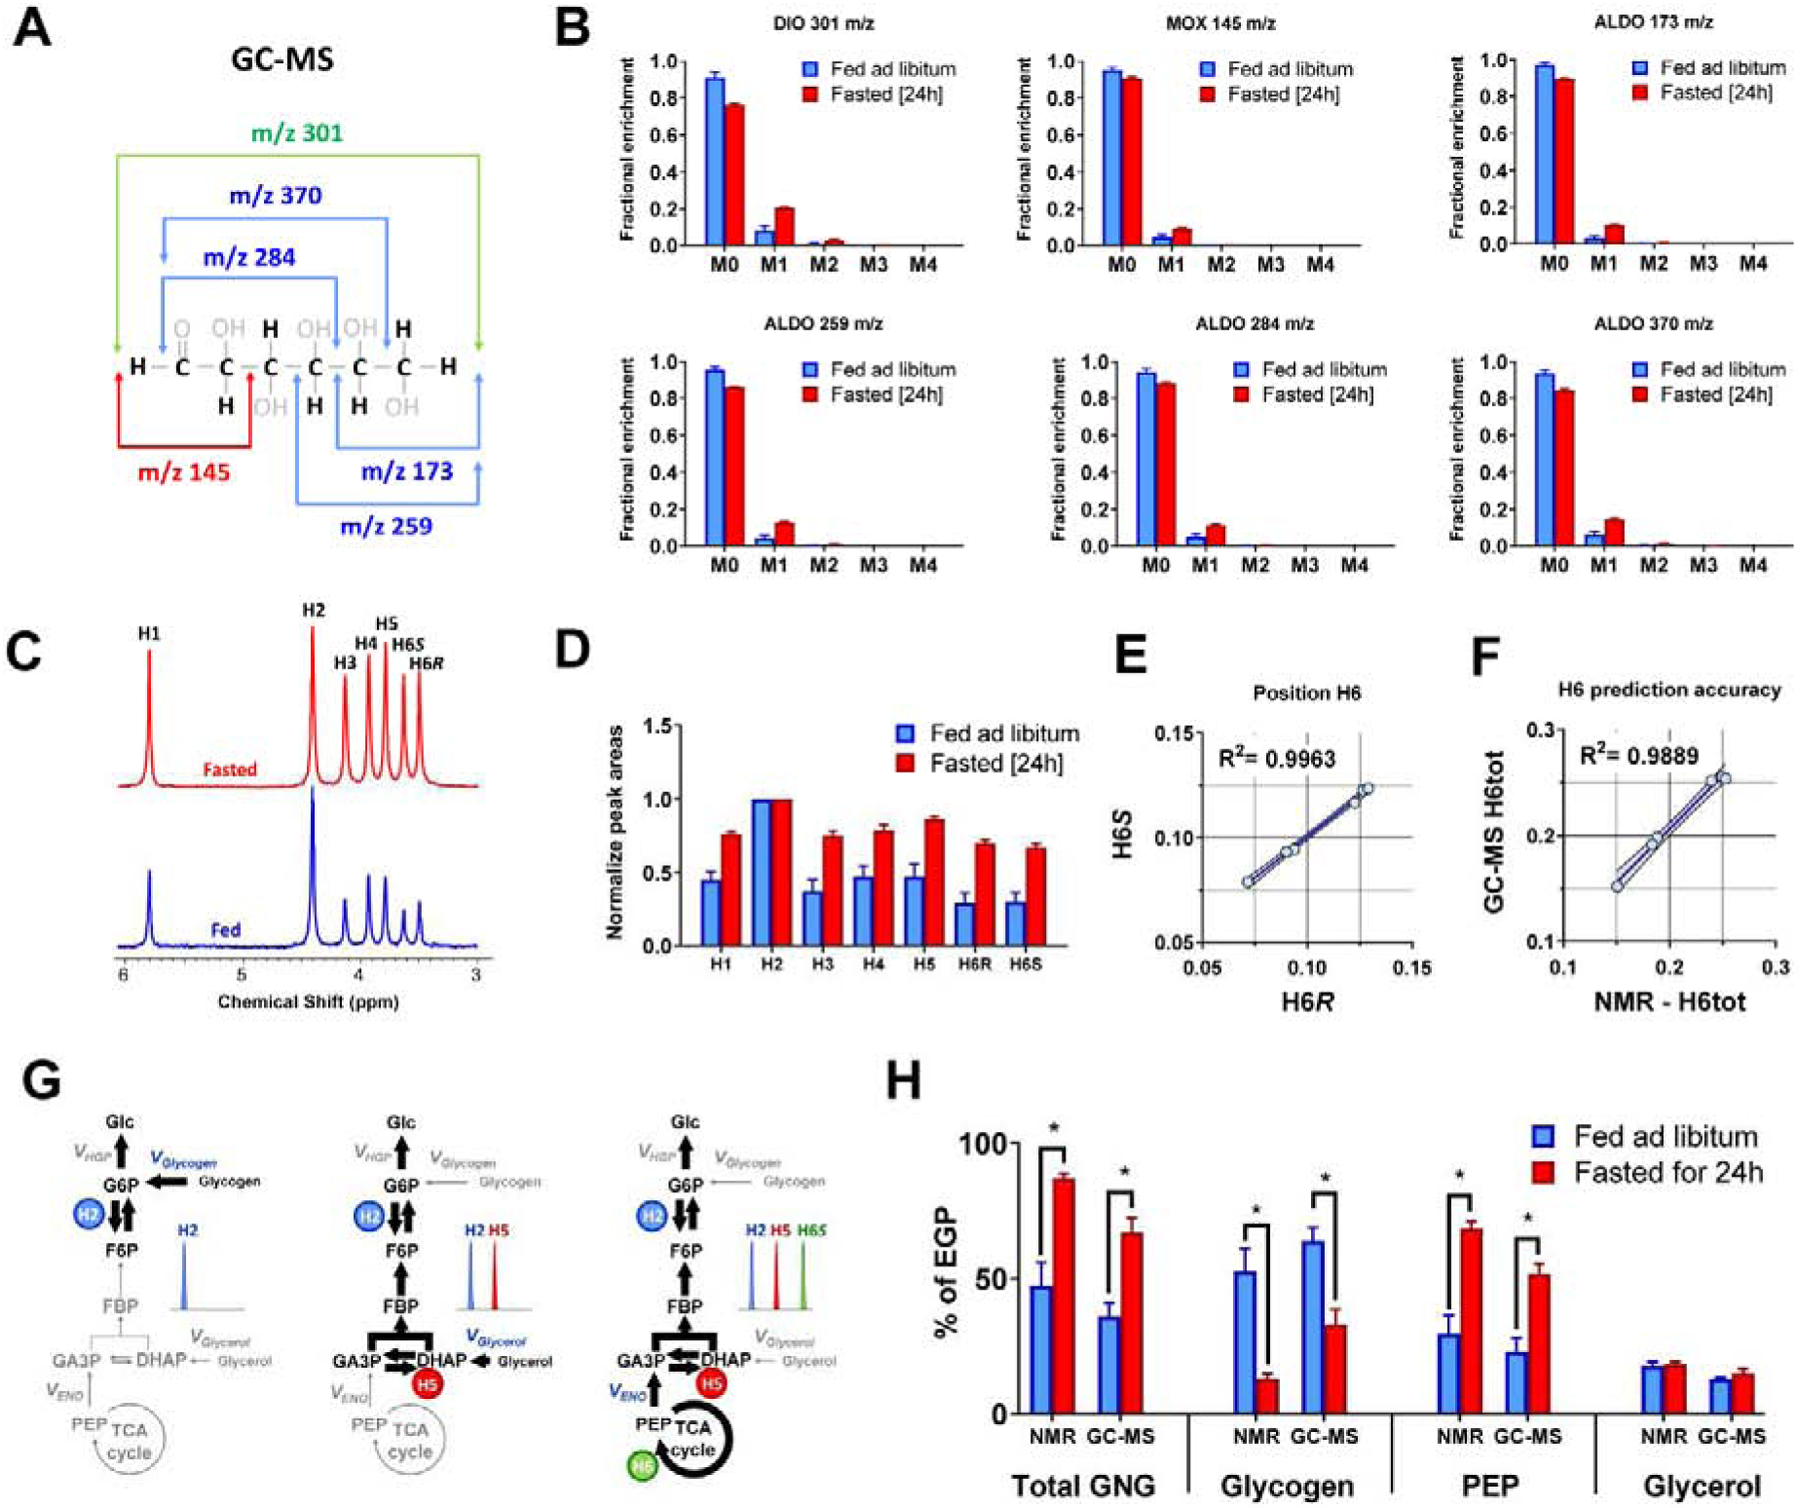
Figure 3. Glucose labeling from 2H2O – single tracer experiment.

(A) In order to partially decipher positional labeling of glucose, different m/z fragment ions can be monitored by GC-MS, each of which contains a different set of atoms from the parent molecule. (B) Natural abundance corrected MIDs of different glucose fragments analyzed using GC-MS, (C) 2H NMR spectrum of MAG signals normalized to resonance at position H2, (D) integrals of 2H NMR resonances normalized to signal at position H2, (E) Correlation between H6R and H6S position in 2H NMR spectra of rats injected with 2H2O, (F) Correlation between total H6 signal (H6tot) measured using NMR and estimated using least-squares regression from GC-MS data are shown. (G) Schematic representation of 2H labeling of glucose in positions H2, H5 and H6. All newly synthesized glucose molecules become labeled at position H2. Glucose derived from all sources of gluconeogenesis (glycerol or PEP) will be additionally labeled at position H5. Finally, if PEP (but not glycerol) was a precursor for gluconeogenesis, glucose molecules will be simultaneously labeled at positions H2, H5 and H6 (for simplicity other positions are not discussed here, as they are not used for flux calculations using the analytical equations). (H) Comparison of flux contributions to gluconeogenesis obtained using 2H NMR and GC-MS based prediction of glucose positional enrichment.
