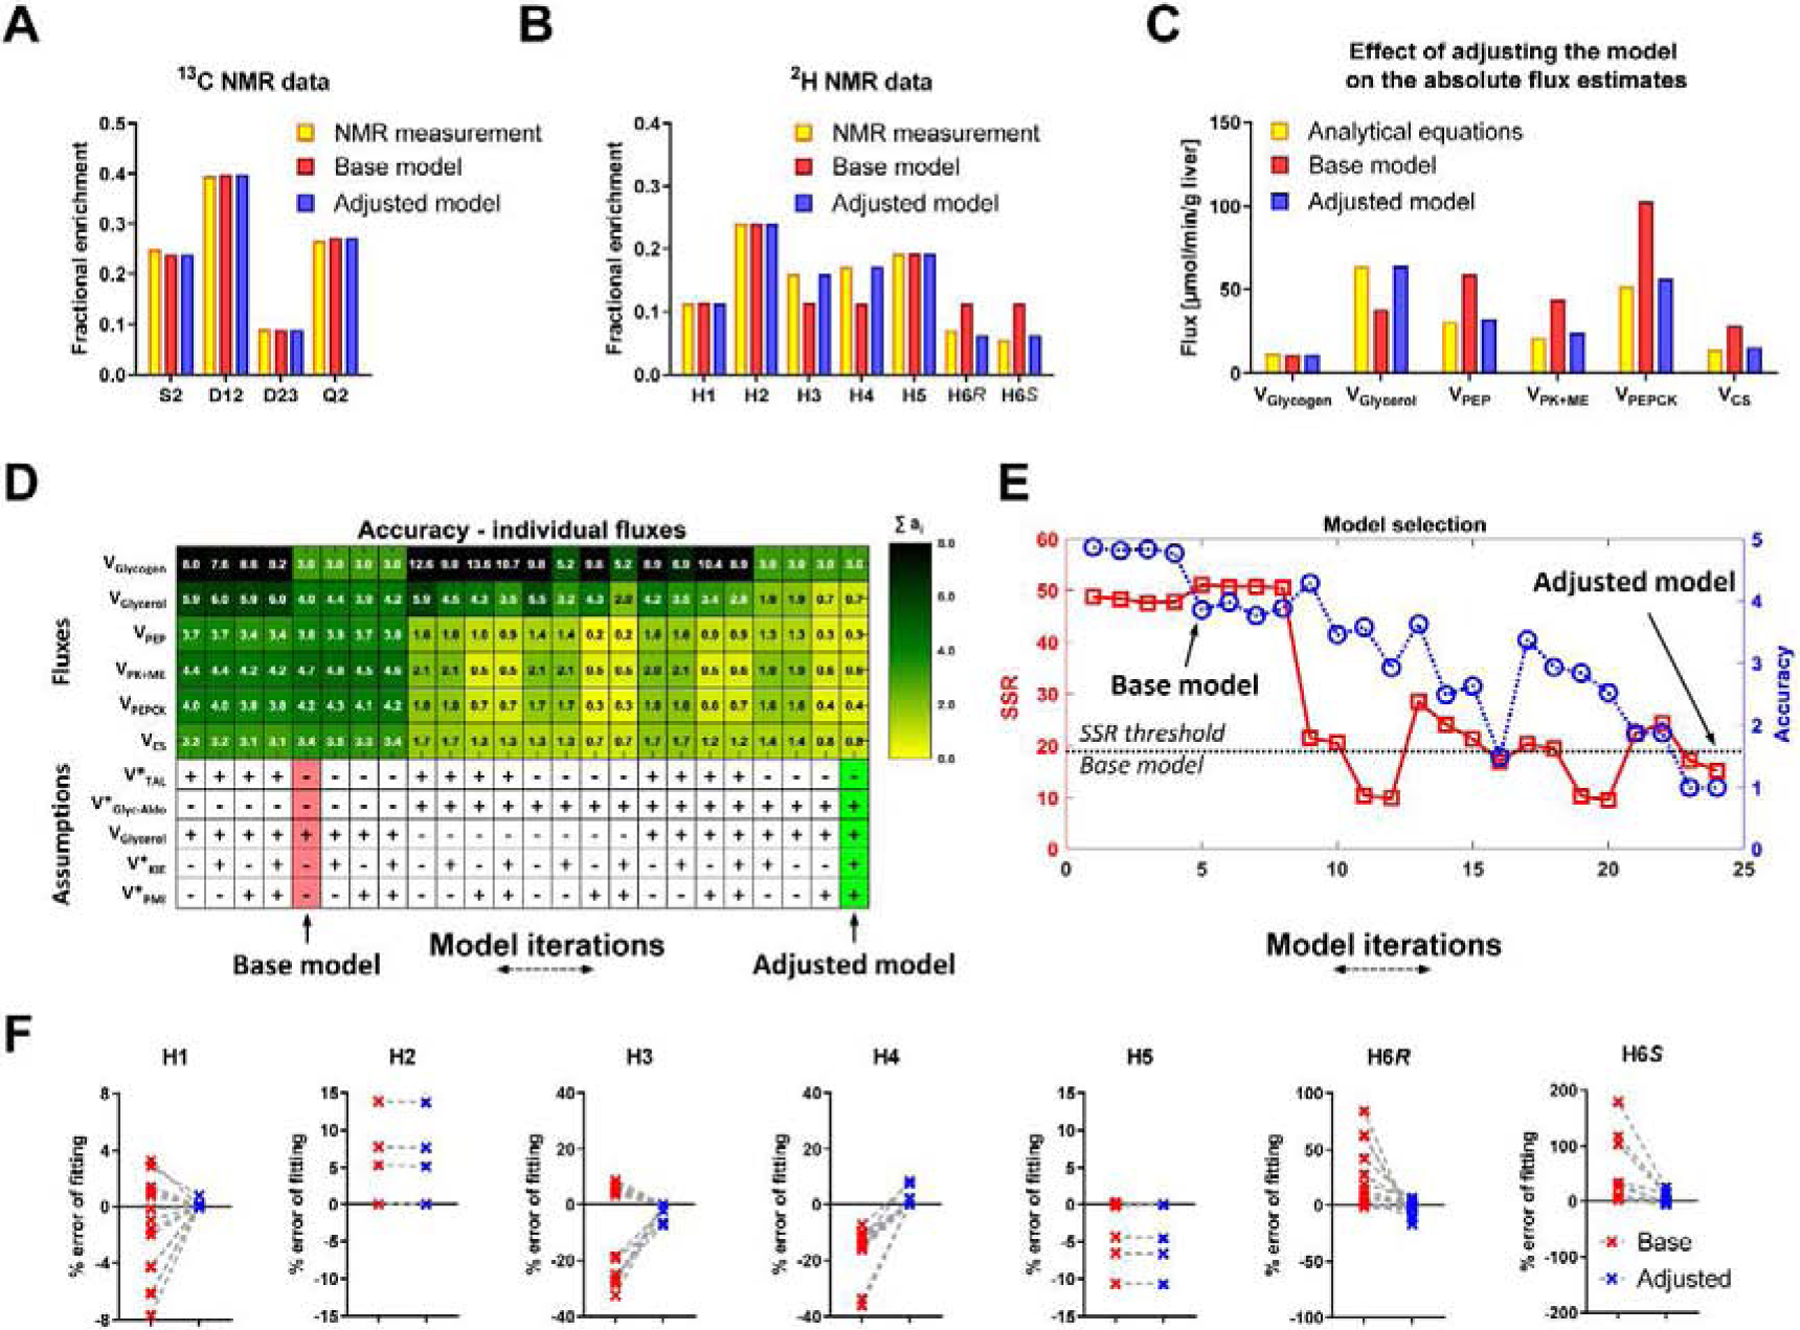
Figure 4. NMR based metabolic flux analysis - model development and validation.

(A,B) An example of NMR measurements and their fits to the base and adjusted model (A) 13C NMR carbon-2 isotopomers of MAG, (B) 2H NMR isotopomers of MAG. (C) An example of changes in absolute fluxes between analytical equations before and after adjusting the MFA model. (D) Heatmap showing contributions of individual flux accuracy scores (ai). Additional reactions (see Table S1) were used in different combinations to create 25 model iterations. Base model (red), Adjusted model (green). VGlycerol is included in the base model but, since VGlyc-Aldo affect the same flux, different combinations of these two reactions were investigated. (E) Accuracy score (A) (blue) and SSR (red). Subsequent model iterations organized in the same order as in panel D, (F) Percent errors of fitting 2H NMR data to base and adjusted model, calculated as follows: (predicted enrichment − measured enrichment)/measured enrichment × 100%.
