
Figure 4.
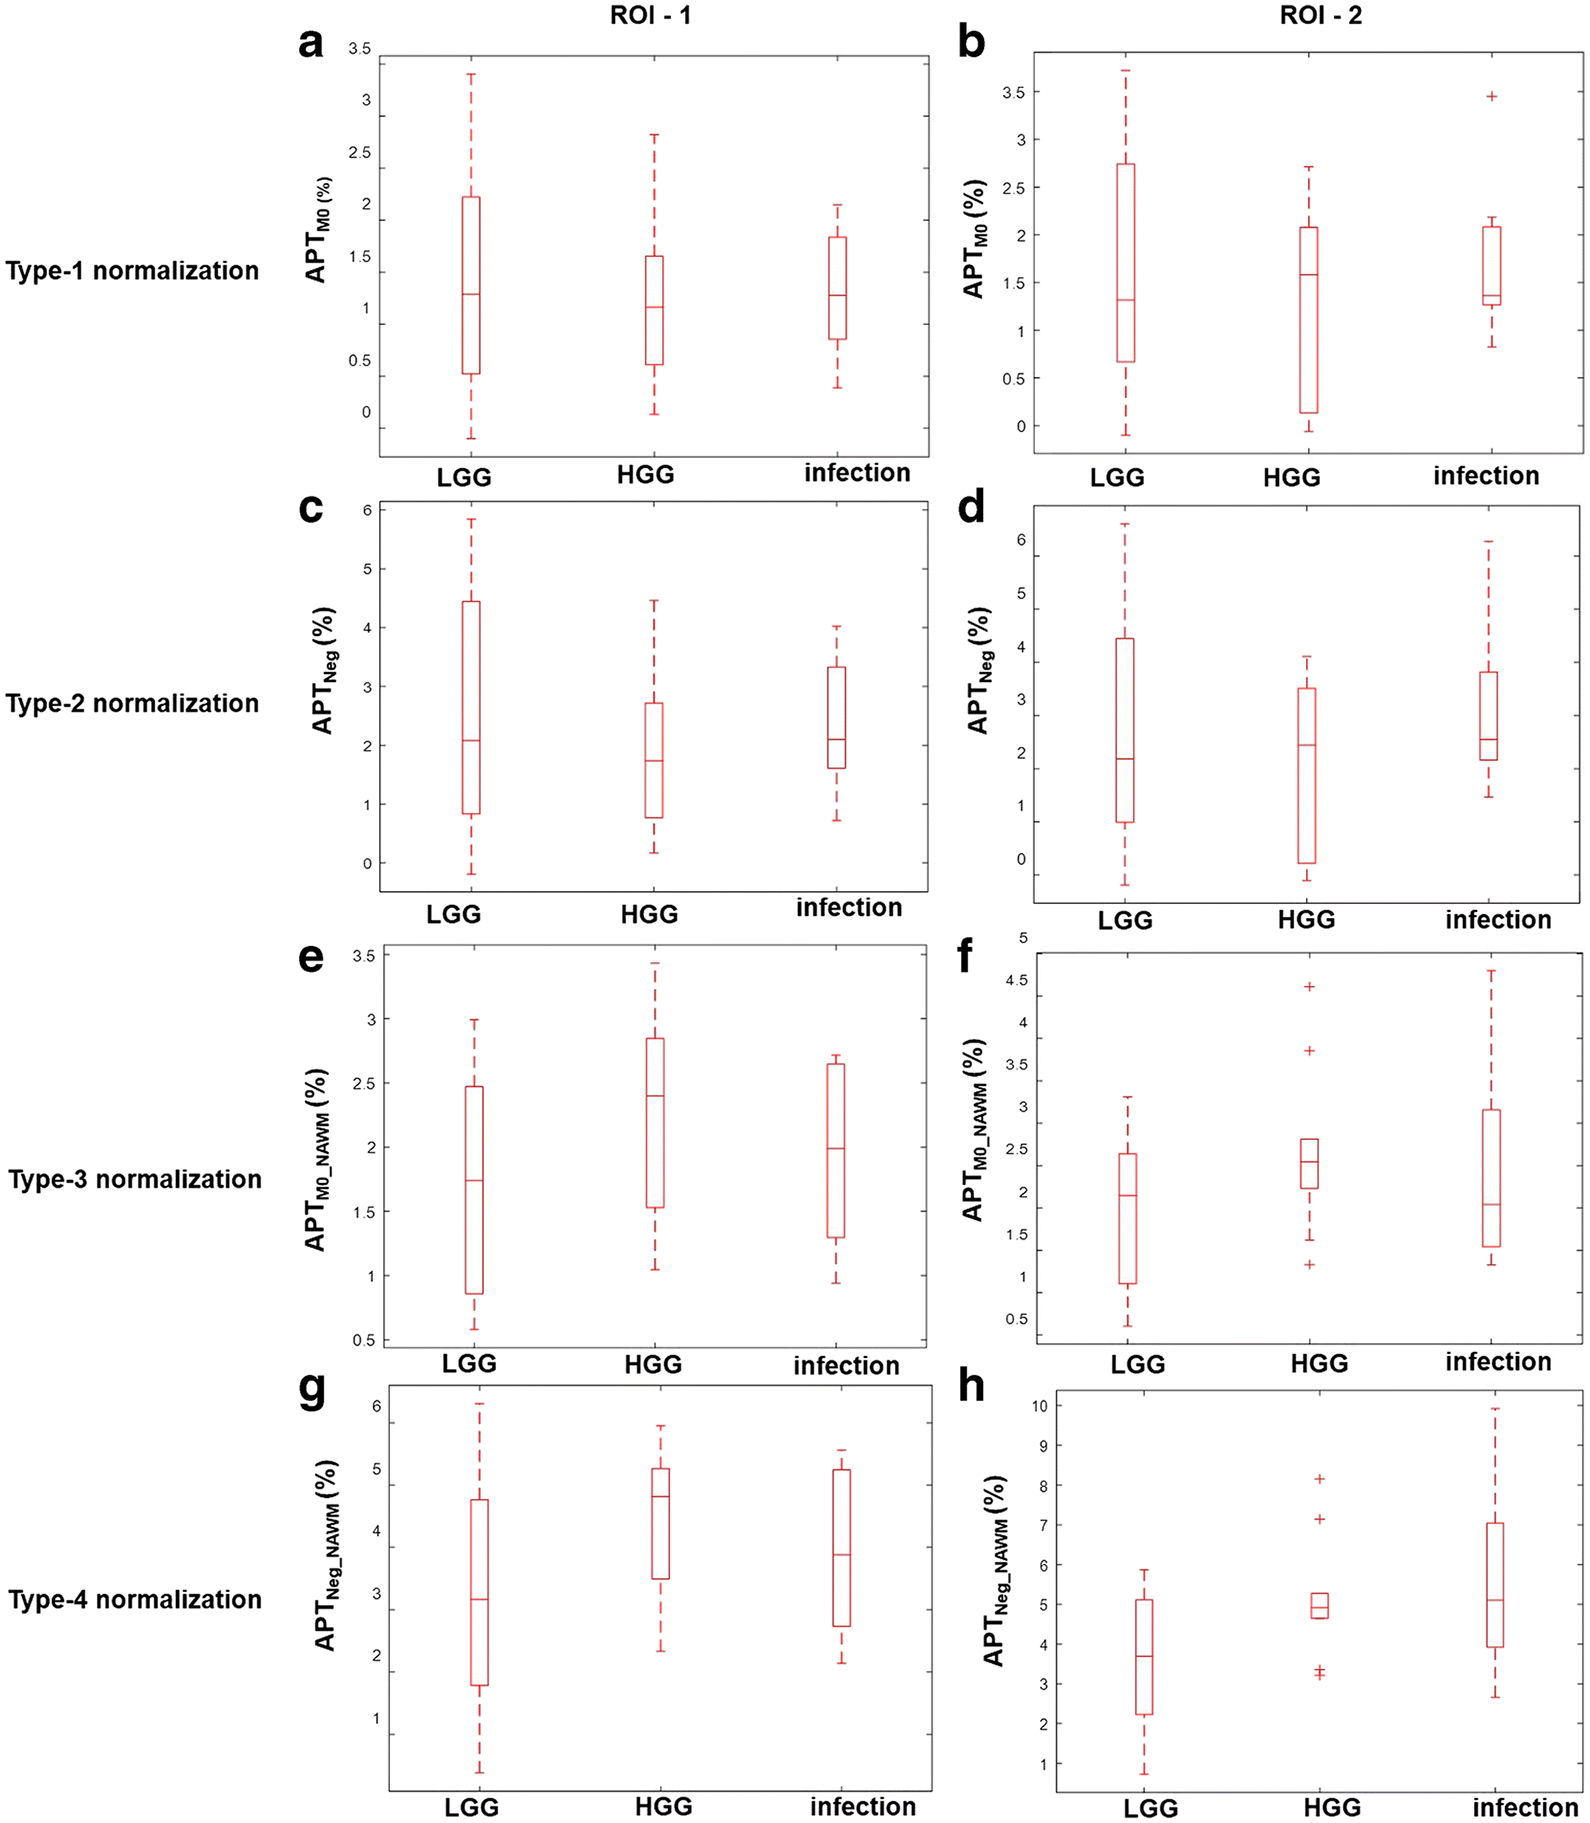
Box and whisker plots show quantitative comparison of different types APT-w contrast normalizations among different groups of ICMLs for two ROIs. ROI-1 represents entire lesion and ROI-2 is active-lesion region. Type-1, Type-2, Type-3 and Type-4 normalizations represents APTM0, APTNeg, APTM0_NAWM and APTNeg_NAWM contrast respectively. Different range of scale was used for different normalizations to obtain better representation and visualization of individual plots. Abbreviation: APT-w – amide proton transfer weighted; ROI – region of interest; LGG – low grade glioma; HGG – high grade glioma.