
Figure 5.
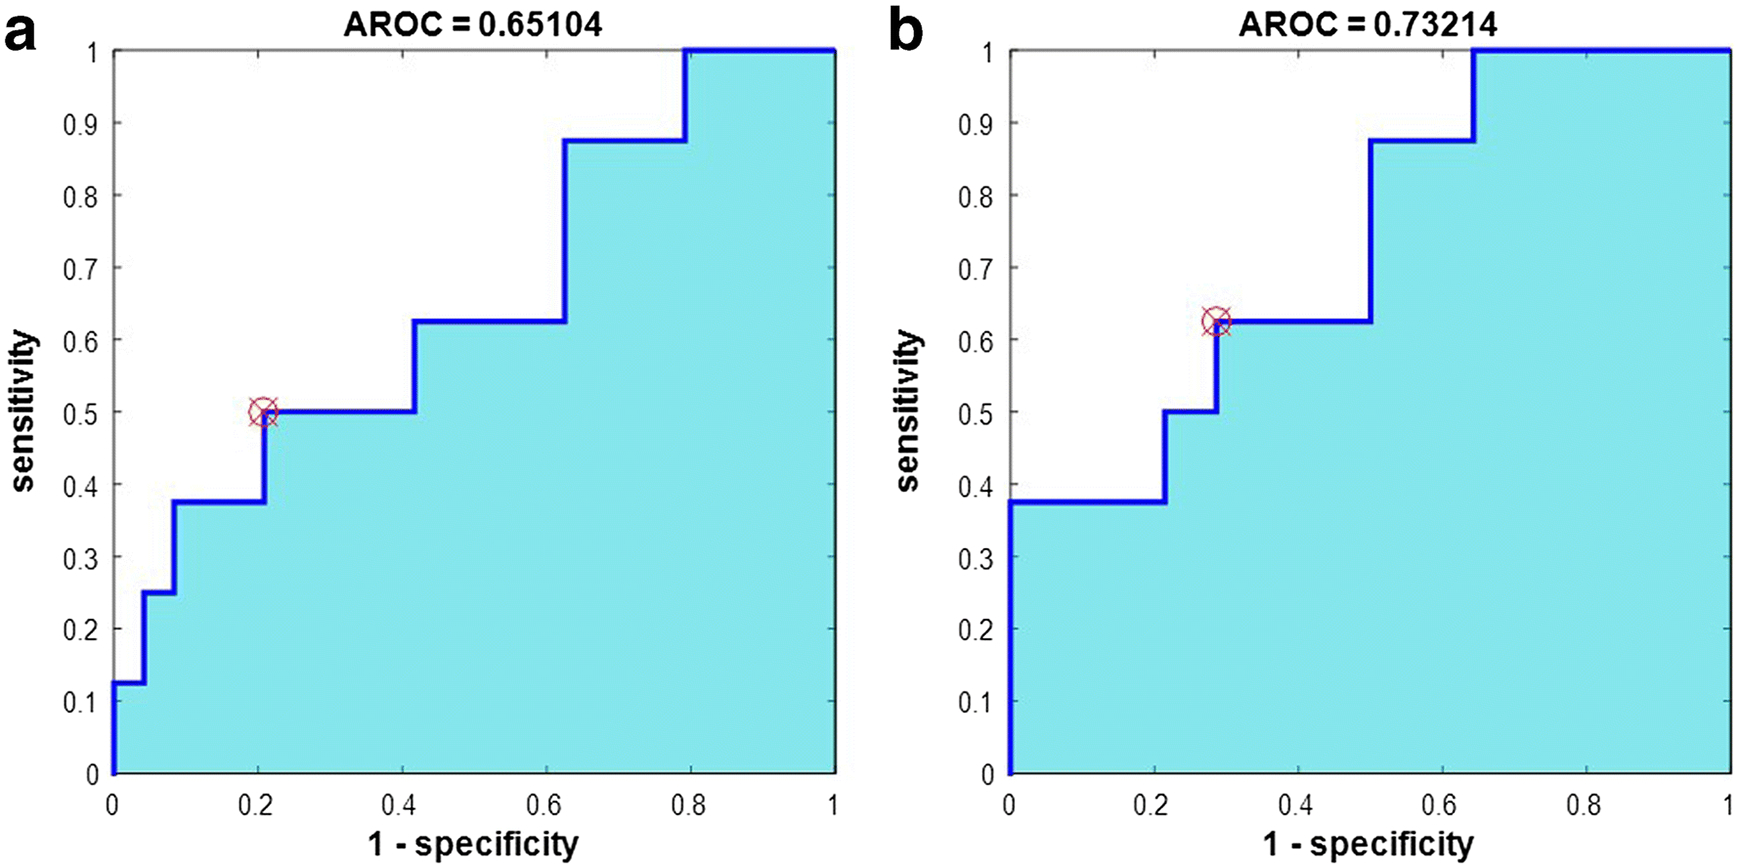
ROC analysis of mean APTNeg_NAWM-w contrast (Type-4 normalizations) corresponding to ROI-2 for differentiation between a neoplastic and infective mass lesion and between b low grade glioma and infective mass lesion. Abbreviation: AROC – area under curve for ROC plot.