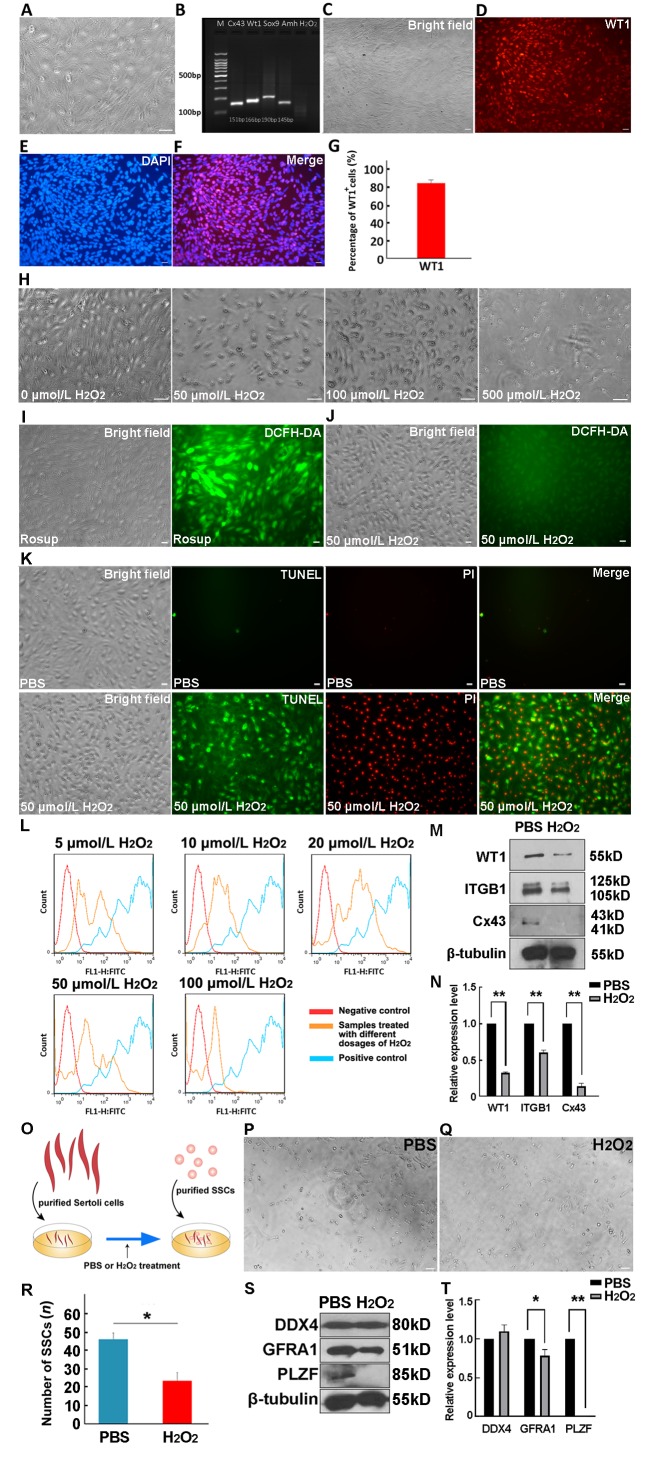
1. Hyperactive reactive oxygen species (ROS) disturbed expression of Cx43 in Sertoli cells and affected co-cultured SSCs.
A: Purified Sertoli cells were plated on dishes for culture. B: Expression levels of Sertoli cell markers, Cx43, WT1, AMH, and Sox9, were detected in purified Sertoli cells by RT-PCR, n=3. C−F: Purity of Sertoli cells was determined using IF staining against WT1 (C: Bright field; D: WT1; E: DAPI; F: Merge). G: Percentage of WT1+ cells is presented as mean percentage±SEM, n=5. H: Morphology of Sertoli cells treated with 0, 50 μmol/L H2O2, 100 μ mol/L H2O2, or 500 μmol/L H2O2 is shown. I, J: Images of DCFH-DA fluorescence were taken for positive control group (Rosup provided by the Reactive Oxygen Species Assay Kit, Beyotime) (I) and 50 μmol/L H2O2-treated group, n=5 (J). K: Apoptosis signal detection using Annexin V-FITC/PI kit. PBS- and 50 μmol/L H2O2-treated groups, n=5. L: ROS levels in Sertoli cells treated with different concentrations of H2O2 (5, 10, 20, 50, or 100 μmol/L, n=3) were analyzed by flow cytometry. M, N: Sertoli cells treated with PBS or 50 μmol/L H2O2 for 48 h were harvested to detect protein levels of WT1, ITGB1, and Cx43 using Western blotting, with data presented as means±SEM, n=3, **: P<0.01 (N). O: Schematic of Sertoli cell and SSC co-culture system. P, Q: Morphology of co-culture of SSCs maintained with PBS- (P) or H2O2- (Q) treated Sertoli cells for 48 h is displayed. R: Number of SSCs in PBS- or H2O2-treated Sertoli cells was statistically analyzed, n=3. S, T: Protein levels of DDX4, GFRA1, and PLZF in PBS- and H2O2-treated SSCs were analyzed using Western blotting; Data are presented as mean percentage±SEM, n=3, *: P<0.05, **:P<0.01 (t-test) (T). Scale bars: 20 μm.

