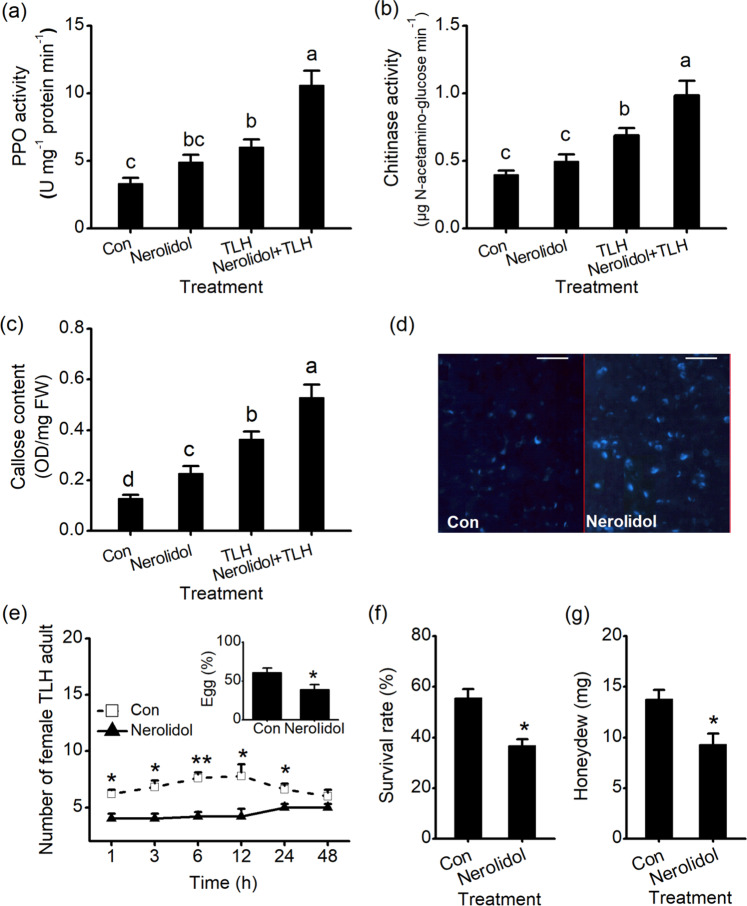
Fig. 8. Effect of (E)-nerolidol on the defense of tea plants against E. onukii.
a–c PPO activities (a), chitinase activities (b), and callose contents (c) in tea plants under Con, Nerolidol, TLH, and Nerolidol + TLH treatments. For the Nerolidol treatment, tea plants were exposed to (E)-nerolidol for 0.5 h and ventilated for 0.5 h, and the second leaves were collected for measurement 12 h after treatment. For the TLH treatment, tea plants were infested with15 E. onukii for 12 h. For the Nerolidol + TLH treatment, tea plants were exposed to (E)-nerolidol for 0.5 h, ventilated for 0.5 h, and infested with E. onukii for 12 h. Values are presented as the means + SEs for five biological replicates. d Callose deposition in control leaves (Con) and (E)-nerolidol-treated leaves. Aniline blue was used to stain tea leaves to detect callose. Scale bars represent 50 μm. e The numbers of E. onukii female adults on (E)-nerolidol-treated plants and controls. The inset shows the percentage of TLH eggs on pairs of plants, 3 days after TLH was released. Values are presented as the means + SEs for six independent biological replicates. f The survival rates of TLH nymphs fed on (E)-nerolidol-treated plants and control plants 3 days after the nymphs were placed on the plants. Values are the means + SEs for six biological replicates. g The amount of honeydew per day per TLH female adult fed on (E)-nerolidol-treated plants or control plants. Values are the means + SEs for fifteen biological replicates. Letters represent significant differences among the four treatments (ANOVA, P < 0.05). Asterisks indicate the significant differences between the treatments and controls (t test, *P < 0.05; **P < 0.01).

