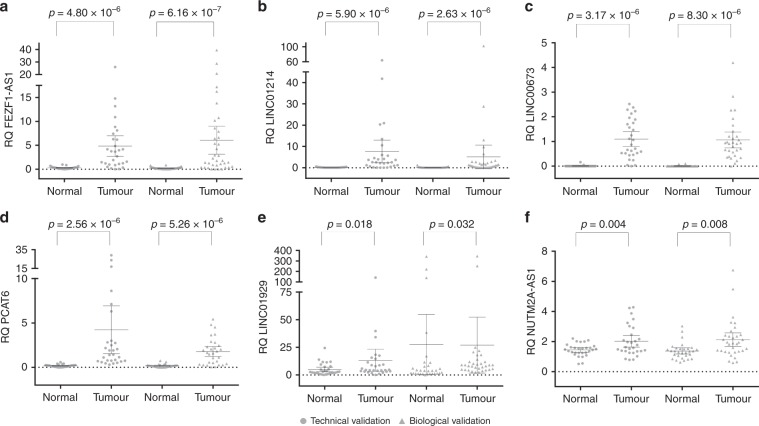
Fig. 1. Overexpressed lncRNAs in NSCLC.
Scatterplot diagrams demonstrating the expression levels of lncRNAs FEZF1-AS1 (a), LINC01214 (b), LINC00673 (c), PCAT6 (d), LINC01929 (e) and NUTM2A-AS1 (f), which are overexpressed in lung tumours compared to adjacent normal lung tissue. Means are also indicated along with the 95% confidence intervals. Technical validation values are given by circles, while biological independent validation values are given as triangles. p-values are derived from Wilcoxon ranked tests. RQ relative quantity.

