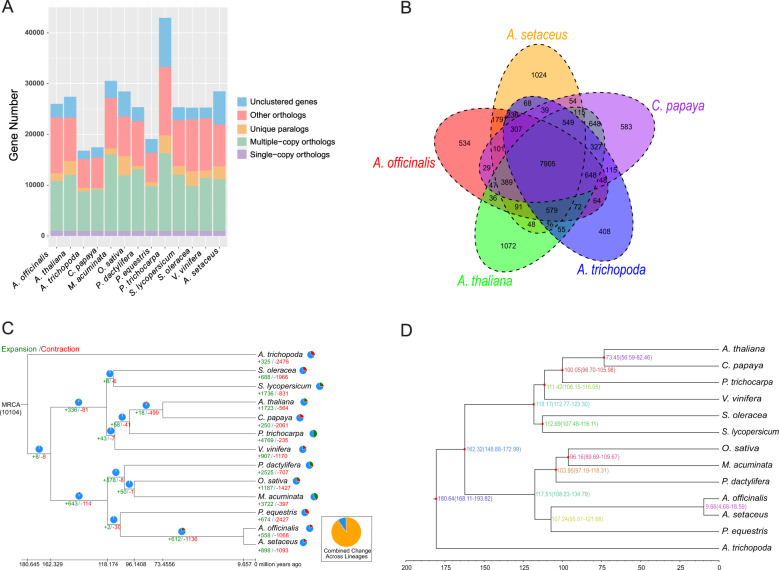
Fig. 4. Gene family and phylogenetic analysis of A. setaceus and other representative plant genomes.
a Clusters of orthologous and paralogous gene families in A. setaceus and 12 other sequenced plant genomes. b Venn diagram representing the distribution of shared gene families among A. setaceus and four other plants (A. officinalis, A. thaliana, C. papaya, and A. trichopoda). c CAFÉ-based estimates of gene family expansions and contractions. The green and red numbers indicate expanded and contracted gene families, respectively. Conserved gene families are indicated in blue in the pi charts. MRCA represents the most recent common ancestor. d Phylogenetic tree of A. setaceus and 12 other species based on a concatenated alignment of 1002 single-copy ortholog gene sets. The tree is rooted with A. trichopoda as the outgroup

