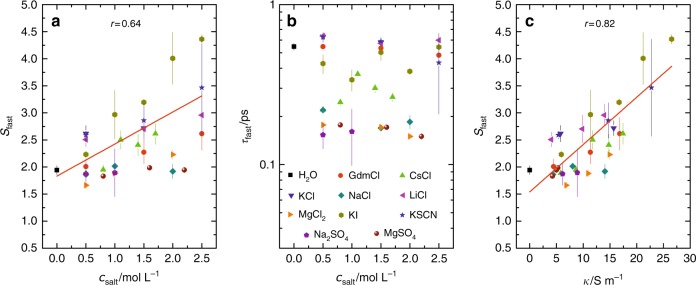
Fig. 3. Effect of the ion type on the spectroscopically observed fast dynamics.
a Amplitude, Sfast, of the fast mode as a function of salt concentration, csalt. The variation of Sfast with csalt largely varies with the salt type. The solid line shows a linear fit to all data, with a Pearson’s correlation coefficient of r = 0.64. b Relaxation time of the fast Debye mode as a function of salt concentration. c Sfast as a function of electrolyte conductivity, κ. The solid lines show a linear fit to all data, with a Pearson’s correlations coefficient of r = 0.82, demonstrating the scaling of Sfast with conductivity. Error bars in all panels correspond to the standard deviation within six independent measurements.

