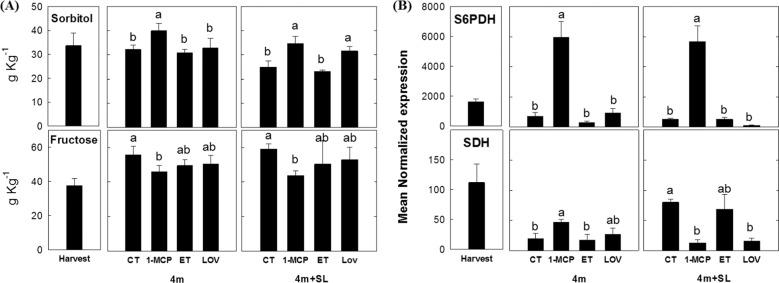
Fig. 9. Content of sorbitol and fructose (g kg–1) and related gene expression.
Values represent the average ± standard deviation (n = 3) (panel a) and expression profile of genes related to the biosynthesis (S6PDH) or degradation (SDH) of sorbitol in “untreated “Blanquilla” pears at harvest, and untreated (CT) or treated fruit (1-MCP, ethylene (ET), or lovastatin) after 4 months of cold storage, and after 4 months of cold storage plus 5 days of ripening at 20 °C (SL). The error bars represent the standard error of mean-normalized expression (panel b). Different letters above each column indicate significant differences between treatments for each specific sampling (4 m or 4 m+SL). Absence of letters indicates no significant differences between treatments

