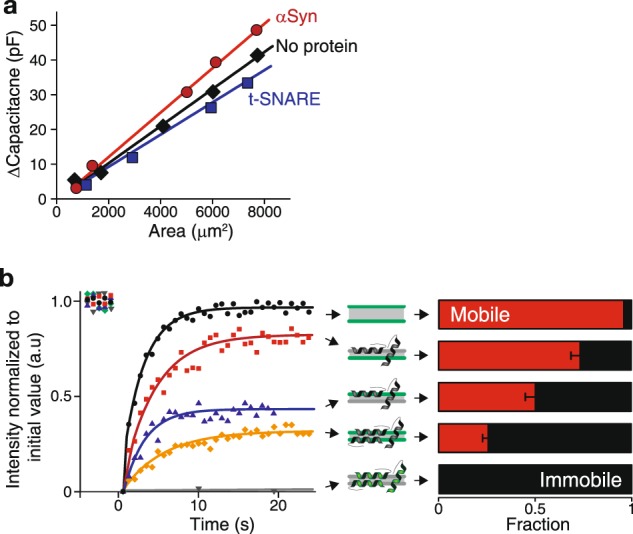
Fig. 4. Capacitance increase and freezing of the membrane upon binding of αSyn.

a Capacitance alteration by membrane proteins. The specific capacitance is the slope of the linear dependence of the capacitance with the membrane area during bilayer zipping without any protein (black), with 100 nM αSyn (red) and t-SNARE (blue). b Fluorescence recovery after photobleaching of a 10 µm disk when monitoring: (Top, black) the lipids of both leaflets without any αSyn; (Second to the top, red) the lipids of the extracellular leaflet with 100 nM αSyn in the cytosolic channel; (middle, blue) the lipids of the cytosolic leaflet with 100 nM αSyn in the cytosolic channel; (fourth to the top, yellow) the lipids of both leaflets with 100 nM αSyn in both channels; (bottom, grey) labeled αSyn when flowed in at 100 nM in both channels. The mobile and immobile fractions in each case are displayed in red and black respectively. Error bars are standard errors of the mean. The diffusion coefficient of the mobile fraction is typically 12 µm²/s. Green in the cartoon (middle column) indicates the fluorescent leaflet(s) or αSyn. The lipid composition is the same as in Fig. 1.
