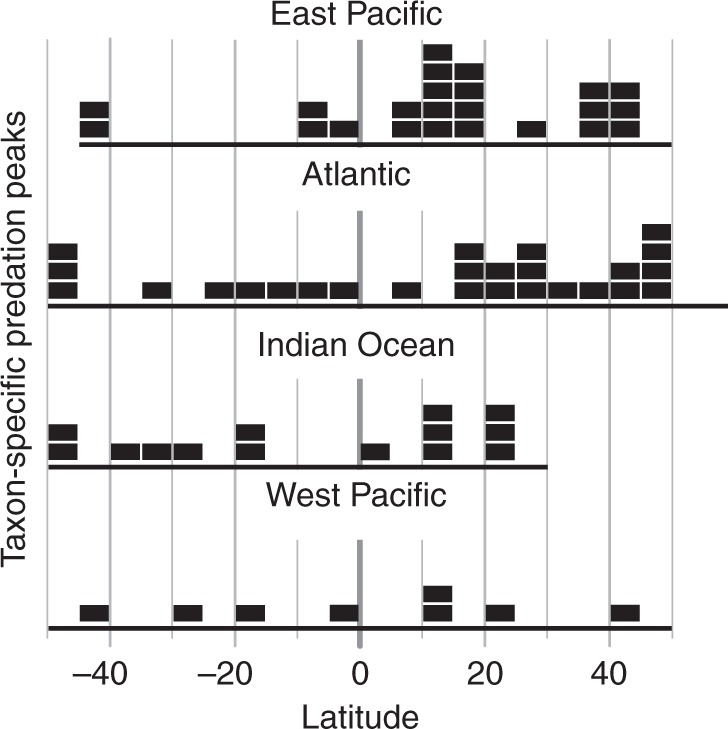
Fig. 3. Distribution of taxon-specific predation peaks across latitude.

The latitude where the predation exerted by each predator taxon (i.e., species or groups of related fish species) is strongest was calculated based on yearly catch per effort data, separately for each ocean basin. Each black box indicates the latitudinal position of one taxon-specific predation peak (number of taxa: East Pacific N = 23, Atlantic N = 26, Indian Ocean N = 14, West Pacific N = 8; See Supplementary Fig. 9 and Supplementary Table 3 for detailed taxonomic information). The length of the x-axis indicates the maximal latitudinal extent covered by the available data for each ocean basin. Source data are provided in Supplementary Data 1.
