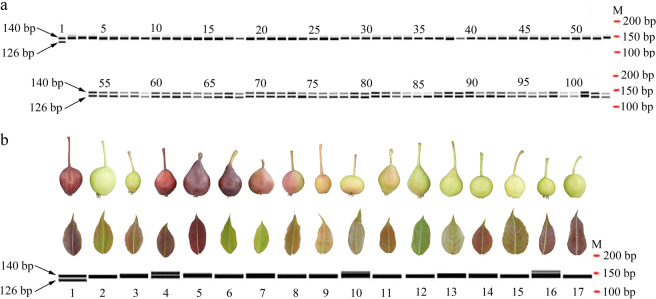
Fig. 4. PCR amplification results of the PpBBX24 gene fragment using the primer pair F-2655 and R-2794 in different DNA samples.
a PCR amplification results of the leaves of “Zaosu Red”, “Zaosu”, “Kuala Pear”, and green and red F1 plants. The maps were generated using LabChip GX Reviewer v5.4 (Perkin-Elmer, USA). M represents “Marker”, and the numbers 1, 2, 3, 4–53, and 54–103 above the bands represent “Zaosu Red”, “Zaosu”, “Kuala Pear”, green F1 plants, and red F1 plants, respectively. b PCR amplification results of the leaves of 18 different cultivars/strains. The band maps were generated using LabChip GX Reviewer v5.4. The numbers below the bands from 1 to 17 represent “Zaosu Red”, “Zaosu”, “Kuala Pear”, “N3-1”, “Red Anjou”, “Red Comice”, “Zhongaihongli”, “Bayuehong”, “Wenshanghongli”, “Pingguoli”, “Jinxiang”, “Zaojinxiang”, “4X Yali”, “Huangguan”, “Dangshansu”, “Jinfeng”, and “E1-2”, respectively. The leaves and fruits of these cultivars/strains are shown above the corresponding bands. Among these fruits, 1 and 4–6 are fully red, 7–9 are partly red, 3 and 10–11 are reddish, and 2 and 12–17 are fully green

