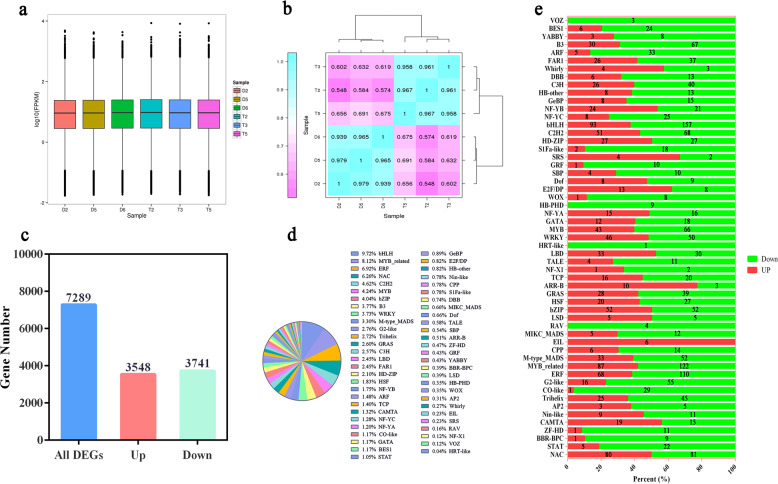
Fig. 6. Summary of Illumina sequencing based on the full-length transcriptome.
a FPKM box plot of the second-generation transcriptome of each sample. b Correlation heat map of expression in two pairs of samples according to next-generation sequencing. c Summary of the DEGs according to the second-generation transcriptome. d Statistics of differentially expressed TFs in L. ruthenicum of different ploidies. e Investigation of the up- and downregulation of differentially expressed TFs

