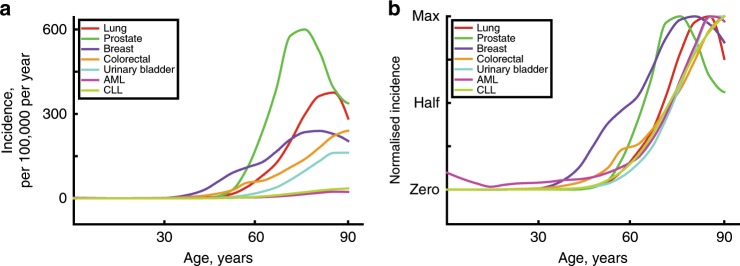
Fig. 1. Age-dependent incidence for the most common cancers and leukaemias.
The incidence of the five most common cancers (excluding skin cancers) and the two most common leukaemias in the United States from 2012 to 2016. Data are from the National Cancer Institute (www.seer.cancer.gov). a Absolute incidence per 100,000 people per year by age. b Normalised incidence was derived by first subtracting the minimum value from each value in a data set (to set the minimum to zero on the Y-scale) and then dividing the resulting values by the maximal (of those resulting) in the data set (removes vertical scale).

